


THE ROOM WHERE IT HAPPENS
I have been in this room.
A financial review. Senior leadership around the table. The measurement team presents the output — a clean number, a ranked list of channels, a recommended reallocation. The number has two decimal places. The recommendation is clear. The conversation moves quickly to budget.
Nobody asks about the confidence interval. Nobody asks whether the model’s training window reflects current market conditions. Nobody asks whether the channels being flagged for reduction were measured using a method capable of capturing their actual contribution. The output looks authoritative. The presentation was well-constructed. The team who built the model are credible. The decision gets made.
I have presented in that room. I have also been the person receiving the output. In both roles, I have made the same mistake: I treated the measurement as the answer when it was, at best, a well-informed signal.
This is not a story about bad data or weak analysts. The data in those presentations was usually sound. The models were often sophisticated. The people involved were among the most analytically capable I have worked with. That is precisely the point.
Measurement misleads smart people not because the data is wrong, but because it provides confident answers within flawed frames — and those frames align with how organisations are structured, incentivised, and rewarded. There is a third force too, and it is the most human one: the pressure to make progress. When commercial urgency is real and the model delivers a confident answer, the caveat does not get ignored out of carelessness. It gets set aside because progress cannot wait for certainty. That is not a failure of discipline. It is a rational response to the environment.
In M004 — The Art and Science of Measurement — this series established that caveats are the interpreter’s responsibility. The person presenting a model output carries the obligation to make its limits visible. M010 is the article that shows what happens when that obligation is structurally difficult to discharge — and why the people most likely to skip over it are often the most analytically capable ones in the room.
(This piece builds on M009 -- Measurement as Risk Management and M004 -- The Art and Science of Measurement. If you are new to the series, those two are worth reading first.)
The Frame Problem
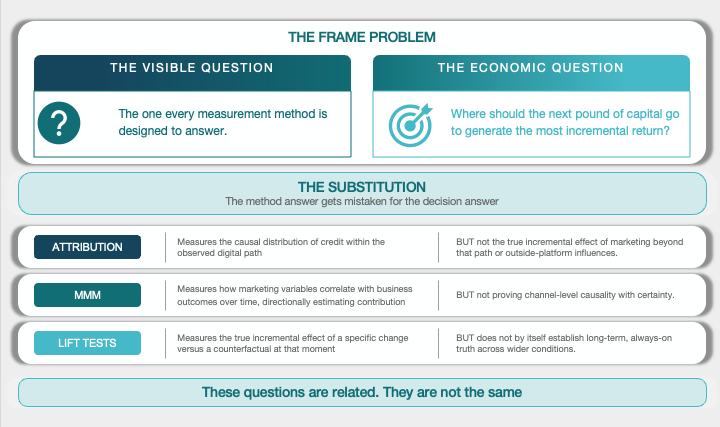
Every measurement method answers a specific, well-formed question. Attribution measures the causal distribution of credit within the observed digital path — but not the true incremental effect of marketing beyond that path or outside what the platform can see. MMM measures how marketing variables correlate with business outcomes over time, directionally estimating contribution — but not proving channel-level causality with certainty. Incrementality and lift tests measure the true incremental effect of a specific change versus a counterfactual at that moment — but do not by themselves establish long-term, always-on truth across wider conditions.
These are not bad questions. They are the right questions for the methods designed to answer them. The problem is that none of them answer the question the decision-maker actually needs resolved: where should the next pound of capital go to generate the most incremental return?
These questions are related. They are not the same.
When a team uses an MMM output to rank channels by contribution and reallocates budget accordingly, they are treating a directional correlation estimate as a capital allocation verdict. The model did its job. The question it was asked was not the question that mattered for the decision.
This is the first way measurement misleads: it answers the visible question, not the economic one. And because the visible question looks like the economic one — both involve numbers, both involve channels, both involve performance — the substitution goes unnoticed.
Precision Without Truth
The second mechanism is harder to see because it looks like rigour.
Decimal points feel like accuracy. Confidence intervals feel like scientific discipline. Model coefficients feel like stable facts about the world. The more mathematically composed the output, the more authoritative it feels. And the more authoritative it feels, the less likely anyone is to ask what sits underneath it.
What sits underneath it is always a set of assumptions. A lag structure chosen by the analyst. A data window that may not reflect current conditions. Variables that were included because they were measurable, not because they were the most important. Structural blind spots that are features of the method, not failures of execution.
In financial discussions, senior decision-makers expect precise answers. That expectation is reasonable — they are making capital allocation decisions with real consequences. The measurement system delivers a precise answer because that is what the presentation demands. The confidence interval, which is wide, stays in the analyst’s working file. The point estimate travels to the boardroom. The gap between them is exactly where the misinterpretation lives.
M004 argued that the interpreter carries the responsibility for making caveats visible. That is the right principle. The problem is that most presentation contexts make it structurally difficult to honour. A financial review is not a seminar. The room is not waiting for a nuanced discussion of lag structures and confidence bands. It is waiting for a decision. Progress has its own pressure. The caveat slows things down. The point estimate moves things forward. So the point estimate goes on the slide, and the interval stays in the file.
I have been the person who left the interval in the working file. The room wanted a number. I gave them one. The decision that followed was made with less information than it needed.
Precision reduces variance in reporting. It does not reduce variance in business outcomes.
Local Optimisation Looks Like Progress
The third mechanism operates at a system level, which makes it almost invisible from inside any single team.
Attribution drives channel optimisation. Platform AI drives campaign optimisation. Experimentation drives tactic optimisation. Each of these is correct within its own frame. A team optimising against attribution signals is doing exactly what their system rewards. A team running tests to improve tactic performance is behaving rationally within the measurement logic they have been given.
The problem is that local optimisation and global optimisation are not the same thing. A system optimised at the channel level can be misallocated at the portfolio level. A set of tactics that each perform well in isolation can collectively underinvest in the activities that drive long-term demand.
The system fragments truth. Smart people optimise within the fragment. Nobody is rewarded for asking whether the fragment is the right unit of analysis.
Incentives Complete the Trap
The fourth mechanism is the one that makes the others structural rather than accidental.
Measurement does not just inform decisions. It validates the decisions people are already incentivised to make.
Performance teams are rewarded on CPA. They find measurement that supports CPA. Brand teams are rewarded on reach metrics. They find measurement that supports reach. Analytics teams are rewarded on model accuracy. They find measurement that confirms the model. Each team is acting rationally within the incentive structure they operate in. The measurement system obligingly provides the evidence.
This is not cynicism. It is not politics in the pejorative sense. It is how systems behave when measurement, incentives, and organisational structure align. When the incentive and the measurement point in the same direction, the caveat has nowhere to land. The model confirms what the incentive already suggested. The decision feels analytically grounded. It is also predictable.
The most dangerous measurement is not the measurement that is wrong. It is the measurement that is right in a way that happens to confirm what everyone was already going to do.

Speed Amplifies the Problem
The fifth mechanism is a product of how modern marketing systems now operate.
Platforms update daily. AI optimises in real time. Dashboards surface constant variation. The pace of information has accelerated to the point where a week of data feels like a meaningful sample, a two-point movement feels like a trend, and a test that has been running for ten days feels like it has reached a conclusion.
Most of that variation is noise. Most tests are underpowered. Most short-term movement is not structural — it is auction dynamics, day-of-week effects, weather, competitor activity, or random variance that will revert. The signal is slower than the system pretending to read it.
The analytically confident person is particularly exposed here. They have the pattern recognition to see what looks like a signal quickly. That same pattern recognition causes them to act on noise — because the noise resembles patterns they have encountered before. Speed amplifies misinterpretation. The faster the system moves, the faster the wrong inference compounds.
Why Smart People Specifically
This is the part that took me longest to accept.
The problem is not that senior decision-makers are careless. It is that three cognitive patterns — all of which are normally strengths — become liabilities when applied to model outputs.
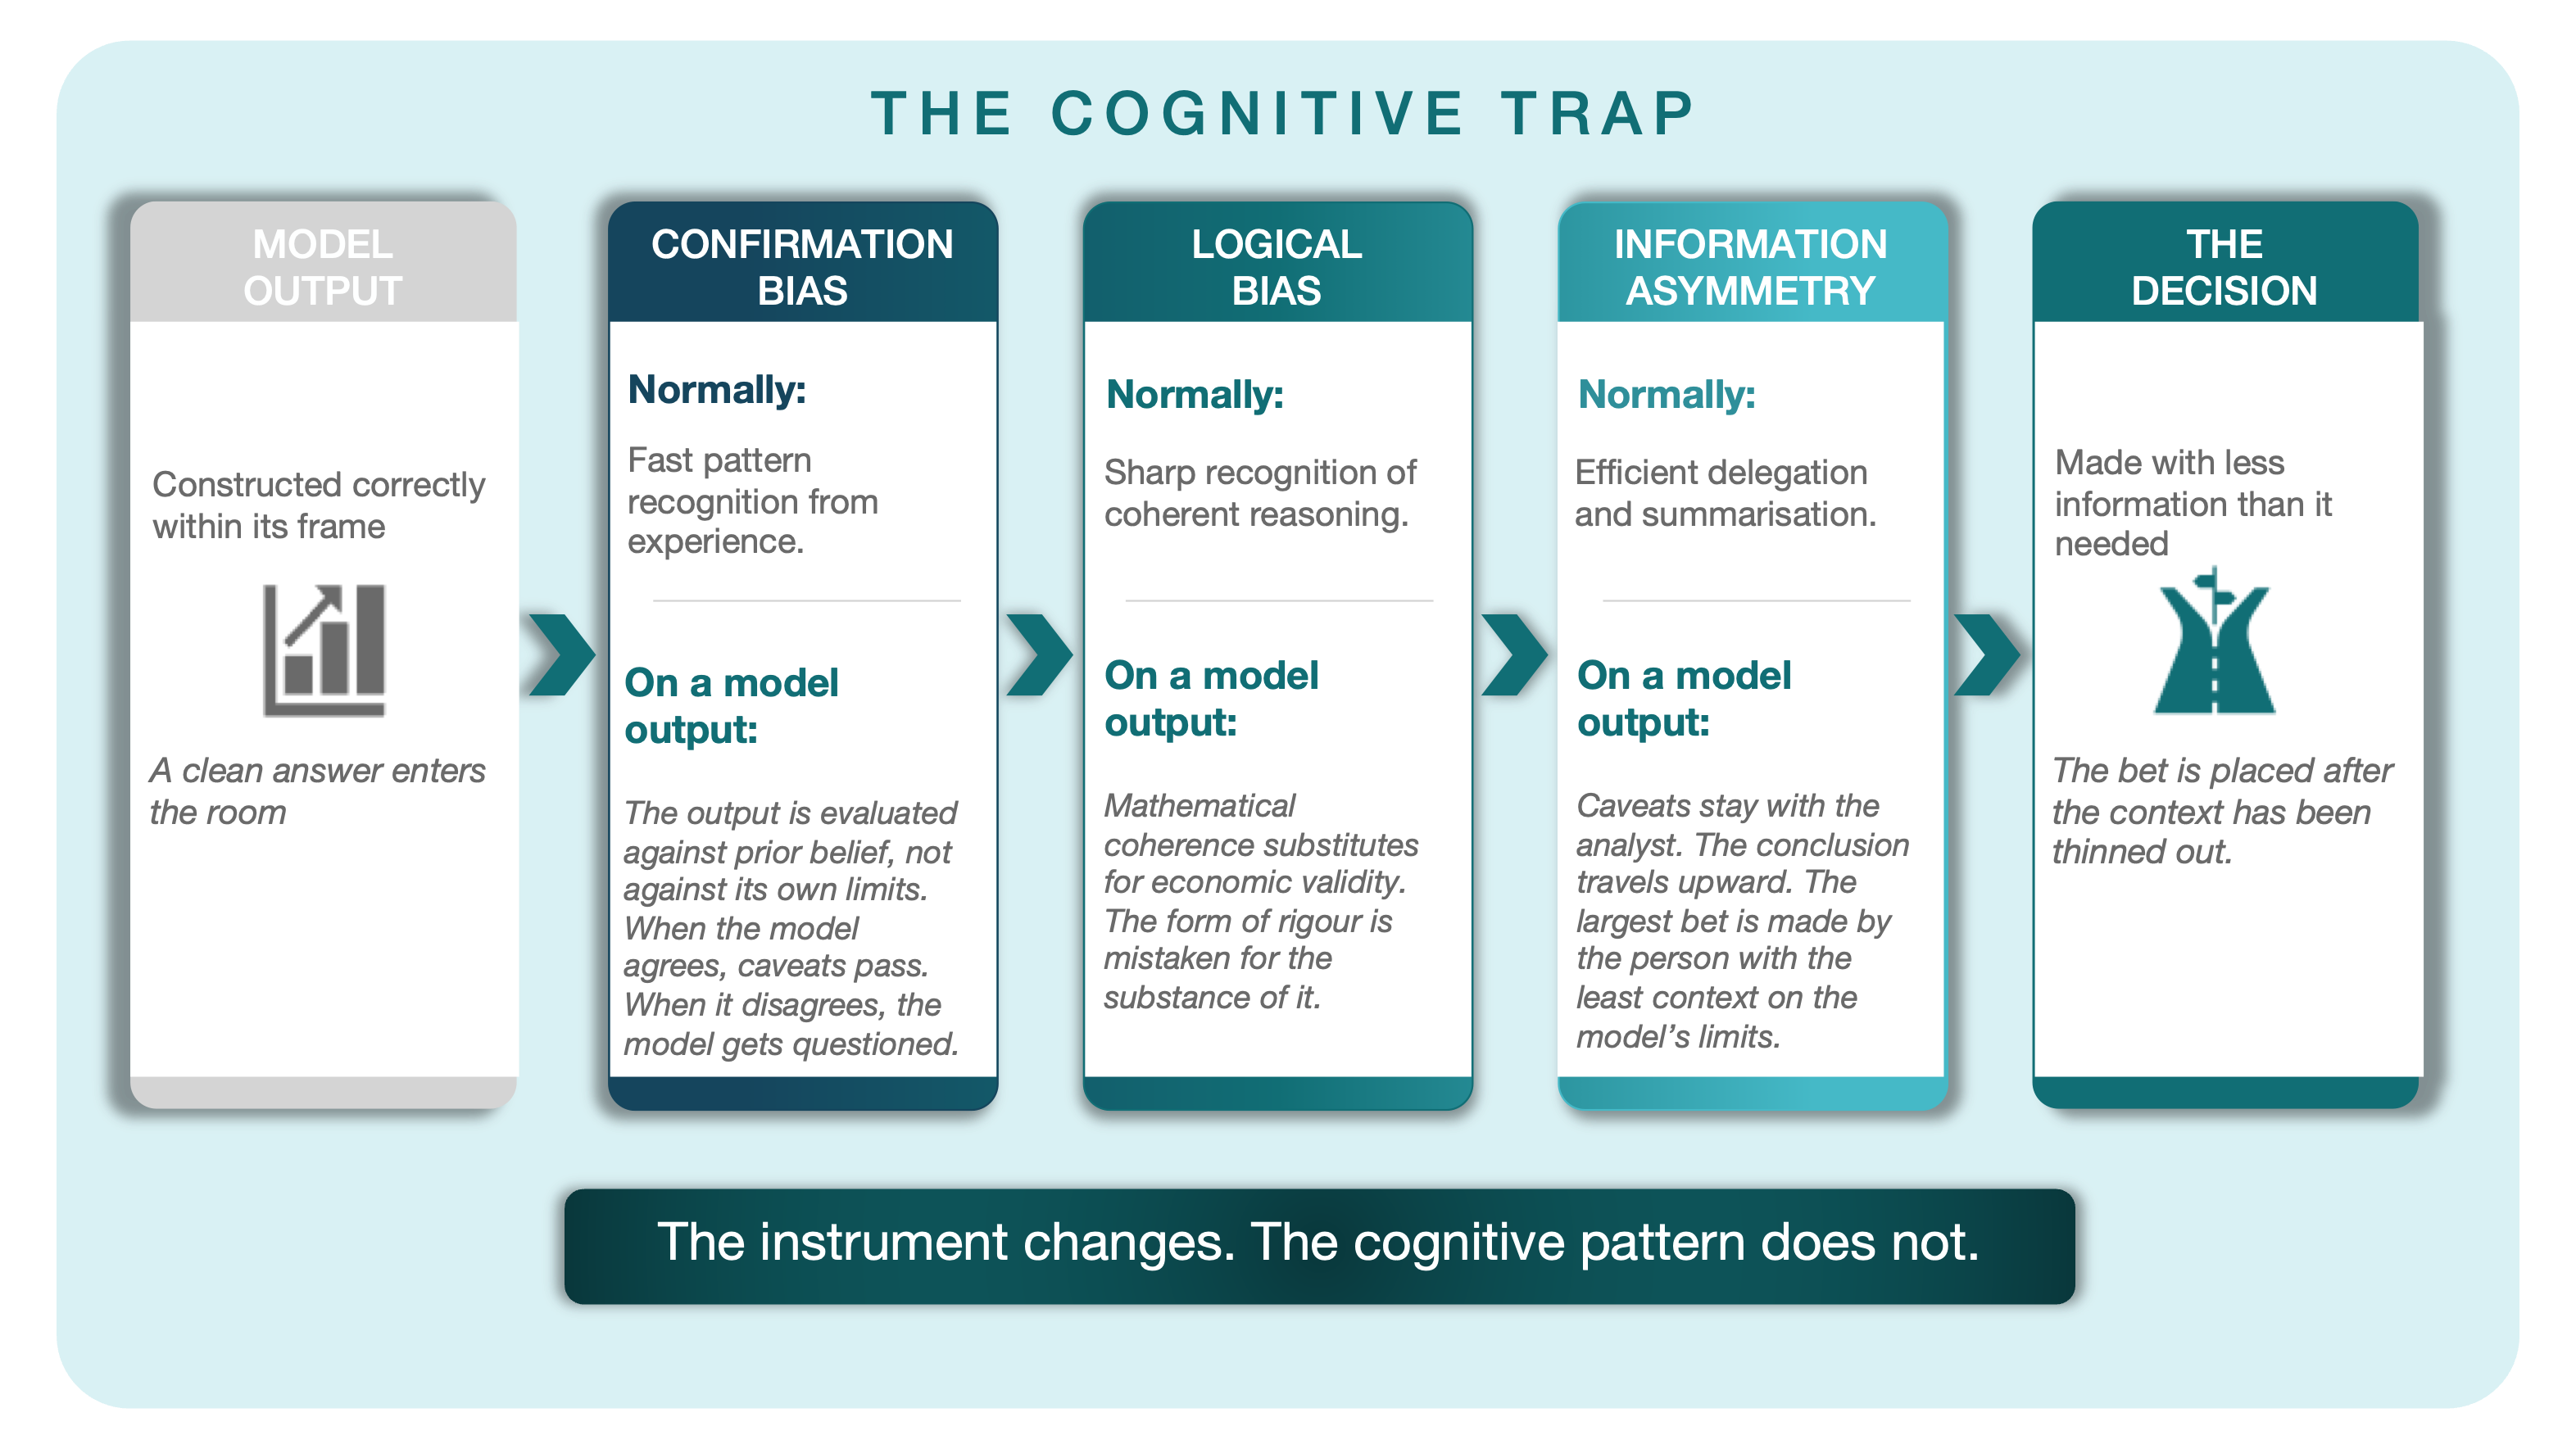
The first is confirmation bias. When a model confirms what an experienced CMO already suspects, the caveats feel like technical noise rather than essential context. When the model contradicts prior belief, the model gets questioned. The output is evaluated against prior belief, not against its own limits. Pattern recognition is an asset in most of what a senior marketer does. Applied to measurement outputs, it becomes a filter that passes confirming evidence and catches disconfirming evidence.
The second is logical bias. Model outputs arrive with mathematical coherence — coefficients, elasticities, ranked contributions, charts with smooth curves. The logic of the presentation does not mean the conclusions are economically correct. But it is harder to argue with something that looks mathematically consistent. The form of rigour substitutes for the substance of it. Smart people are better at recognising logical coherence — and better at being persuaded by it, even when the underlying assumptions are weak.
The third is information asymmetry. The person making the decision sees the output and the recommendation. The person who built the model sees the assumptions, the data gaps, the confidence intervals, and the structural constraints of the method. The caveats live with the analyst. The conclusion travels upward. By the time the decision is made, the person with the least information about the model’s limits is making the largest bet.
This last one is not a failure of intelligence. It is a failure of information architecture. The senior person in that financial review was not incurious. They were working with the information that reached them. The information that reached them was incomplete — not because anyone withheld it deliberately, but because the system was not designed to carry it. And because the commercial pressure to make progress is real, the incentive to simplify before presenting is also real. Caveats feel like friction. Progress feels like the goal.
That is the thread that connects M004 to M010. M004 established that awareness of caveats — and the discipline to make others aware of them -- is the interpreter’s responsibility. M010 shows the forces that make that responsibility so difficult to discharge in practice: the expectation of precision, the pressure to move, and the information architecture that leaves the interval in the file while the point estimate goes to the room.
I include myself in all three patterns. The confirmation bias I have applied to models that told me what I expected. The times I found a coefficient convincing because it was presented well. The clean numbers I carried into rooms, leaving the intervals behind.
The Same Bias, Two Instruments
The mechanism above does not change depending on which measurement method is involved. The instrument changes. The cognitive pattern does not.
Two examples from the same underlying trap:
The MMM channel switch. A model flags a channel as the least performant in the mix. The inference, drawn quickly and with confidence, is: reduce or remove the budget. What the model is actually saying is more limited than that. Within the data it was trained on, using the lag structure the analyst selected, during the observation window available, this channel’s historical contribution was lower than others. That is a directional signal, not a verdict.
What the model cannot say: whether the channel’s contribution was incremental, whether the lag structure captured its effect correctly, whether the priors were calibrated against any causal evidence. Removing a channel entirely is categorically different from reducing its budget. Without an incrementality test, the commercial risk of that decision is unknown. The Sky cookieless targeting work is a clear illustration of this. Econometrics produced a very low measured contribution for that activity — not because the activity was ineffective, but because the model had not incorporated experimentation results as priors and lacked the historical data to estimate the contribution correctly. The geo lift study showed a 2x improvement. The model was not wrong. Treating it as a complete picture was.
Brand search and retargeting. These tactics score brilliantly in last-touch attribution. They sit closest to the purchase event. They intercept high-propensity buyers in the moments before conversion. Attribution measures credit distribution within the observed digital path — and these tactics accumulate it, because they are the last visible interaction before conversion. The same tactics show materially lower contribution in MMM and incrementality testing — because those methods are answering a different question. MMM estimates directional contribution across all marketing variables over time. Incrementality tests the true incremental effect versus a counterfactual at a specific moment. Both tell a more complicated story than attribution does, precisely because they are asking whether the tactic caused the outcome rather than which touchpoint received the credit.
The gap between the attribution score and the incrementality score is not a measurement disagreement. It is a signal that attribution is answering the wrong question for the decision being made. Teams that read attribution as proof of contribution are making systematically wrong investment decisions — not because they are unsophisticated, but because the measurement output they are working with is locally correct and globally misleading.
In both cases, the output was technically accurate within its own frame. In both cases, the frame was the wrong one for the decision. In both cases, the person acting on it was analytically capable and acting in good faith. The trap was not incompetence. It was the alignment between what the measurement showed and what the incentive structure, the information architecture, and the prior belief already pointed toward.
What Changes When You See the Frame
The reframe is not complicated. But it requires a discipline that the measurement system, left to itself, does not provide.
Progress is the right goal. Precision is not the enemy. The problem is when precision becomes a proxy for progress — when a clean number substitutes for a sound decision. The series has argued from M001 onward that precision should not get in the way of progress. M010 adds the harder corollary: the pressure for progress should not become the reason we skip over the caveats that make progress durable.
A model is a lens, not a verdict. The output of a measurement process is a signal — a well-constructed, evidence-based signal, but still a signal. Action should emerge from the interpreted output, not the raw one. The interpreted output is not the raw output with a recommendation attached. It is the raw output held alongside at least one other signal, stress-tested against its own assumptions, and translated into a capital allocation decision with an explicit commercial frame.
This is an information distribution problem as much as a measurement one. The solution is not smarter decision-makers. It is better information design — outputs that carry their own caveats, confidence intervals that travel with the point estimate, cross-method calibration that makes divergence visible rather than hiding it behind whichever model is most convenient.
In practice, this means four things.
Cross-method calibration. No model output should drive a decision without reference to at least one other signal. Where attribution, MMM, and incrementality testing agree directionally, confidence is higher. Where they diverge, the divergence is the most important piece of information in the room — it reveals which question is actually being answered by each method.
Confidence interval accountability. Point estimates should not travel to decision-makers without their intervals. A recommendation that looks sound at the midpoint may be commercially unacceptable at the lower bound. Risk should be applied proportionally to the width of the uncertainty.
Financial payback framing. As established in M009, fixed-horizon NPV is a more honest basis for capital allocation than modelled lifetime estimates. A decision anchored in a recoverable return window is a decision with explicit accountability. If we act on this model output, what is the payback window, and what is the cost of being wrong?
Retrospective scoring. The person who made the recommendation should be accountable for measuring whether the prediction held. Not to punish wrong calls — wrong calls are inevitable in uncertain environments. But to institutionalise the feedback loop. If no one measures whether last quarter’s model-led decision was correct, the model’s limits never surface, and the next decision repeats the same frame.
THE HONEST ANSWER
The measurement system will not fix itself. The incentive structure will not change because the model has limits. The financial review will still want a clean number.
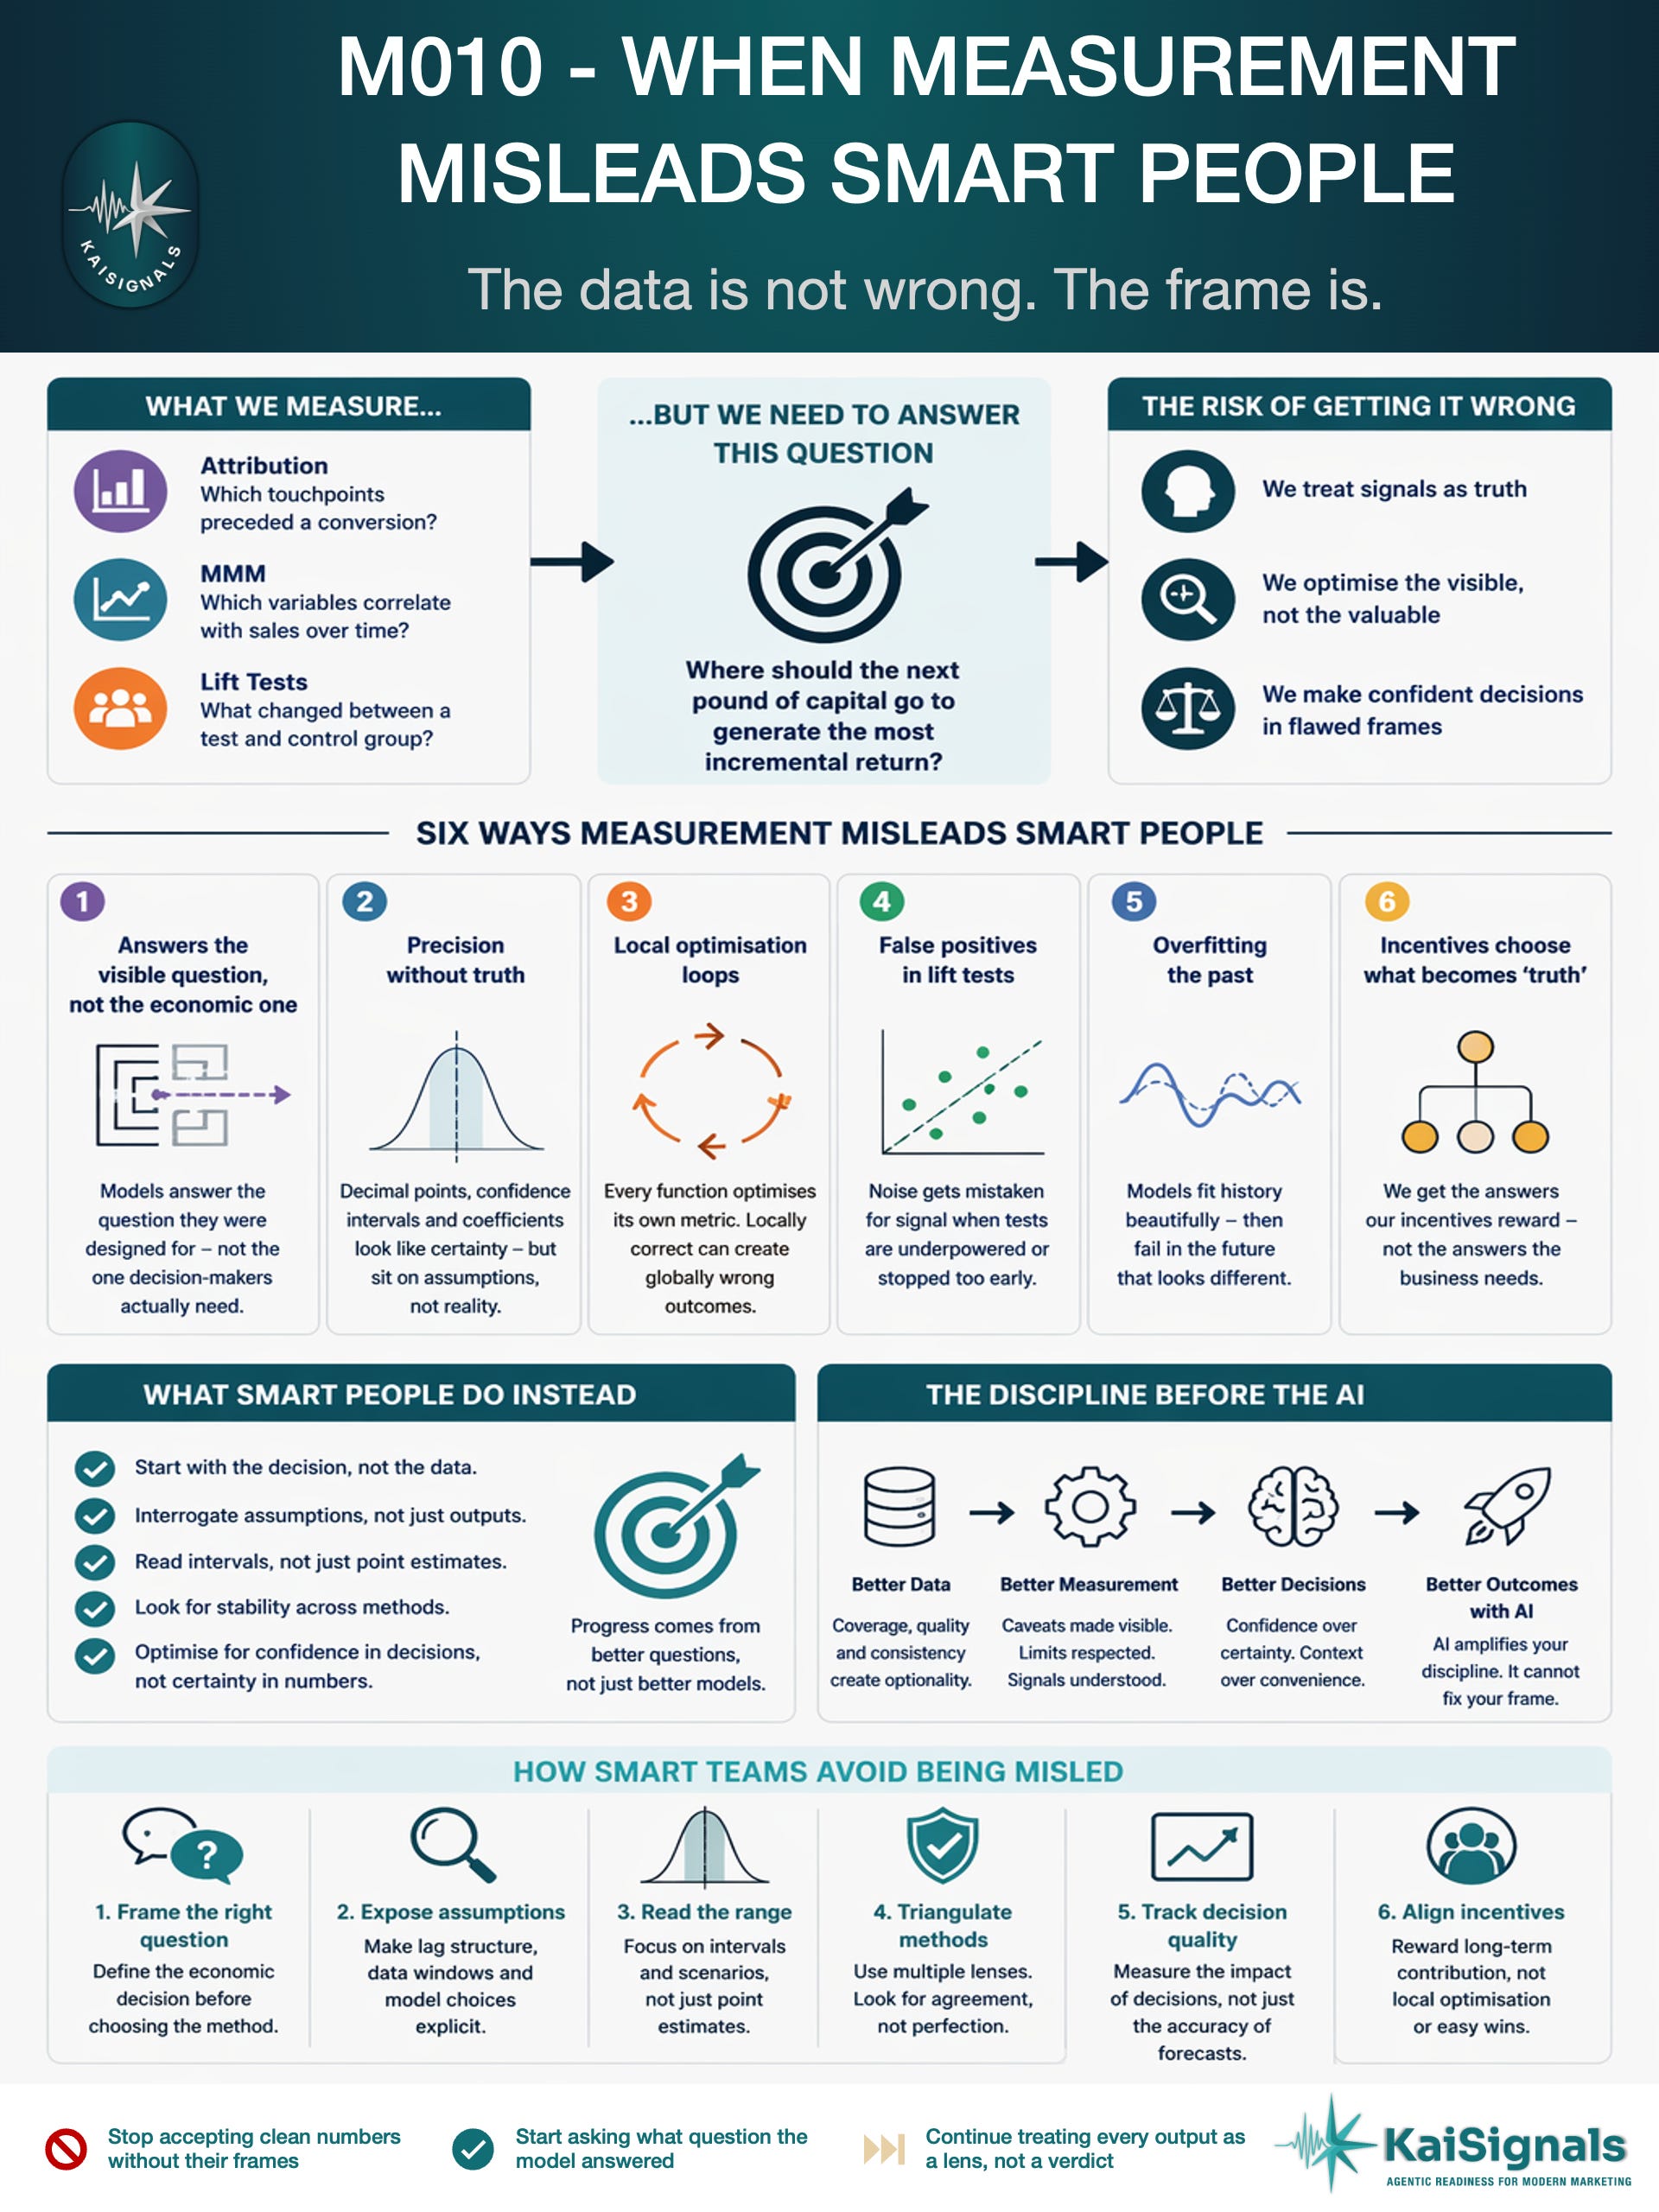
What can change is the discipline applied between the model output and the decision. That discipline is not a tool or a dashboard or a new methodology. It is a practice — of questioning the frame before accepting the answer, of carrying the interval alongside the point estimate, of treating the model as one lens among several rather than a verdict that the room is waiting to act on.
The data is rarely the problem. The frame almost always is.
If models produce signals rather than verdicts, the next question is obvious: what is the mechanism for testing whether the interpretation is correct? That is the question M011 will address. Exploration is not waste. It is the only honest response to the limits this article has described.
“If you are trying to translate these mental models into operating systems that run day to day, this is the problem KaiSignals works on.”