
M012 - MMM: Useful, Not Perfect
The model everyone uses, few read correctly, and no one should use alone.


The Monday Morning Refresh
An MMM refresh lands in the inbox on a Monday morning. Two people open the same file.
The digital marketing lead compares channel performance against the existing plan. Are the recommendations still in line? Does anything need to shift? The analytics lead digs into the multipliers. Has the importance of mid-funnel channels changed? Is search still as incremental as it used to be? Are there new investment opportunities the old curves did not show?
Both are calibrating. Neither is building the model. Both face the same risk: reading the output as a verdict when it is a lens shaped by specific conditions in a specific period.
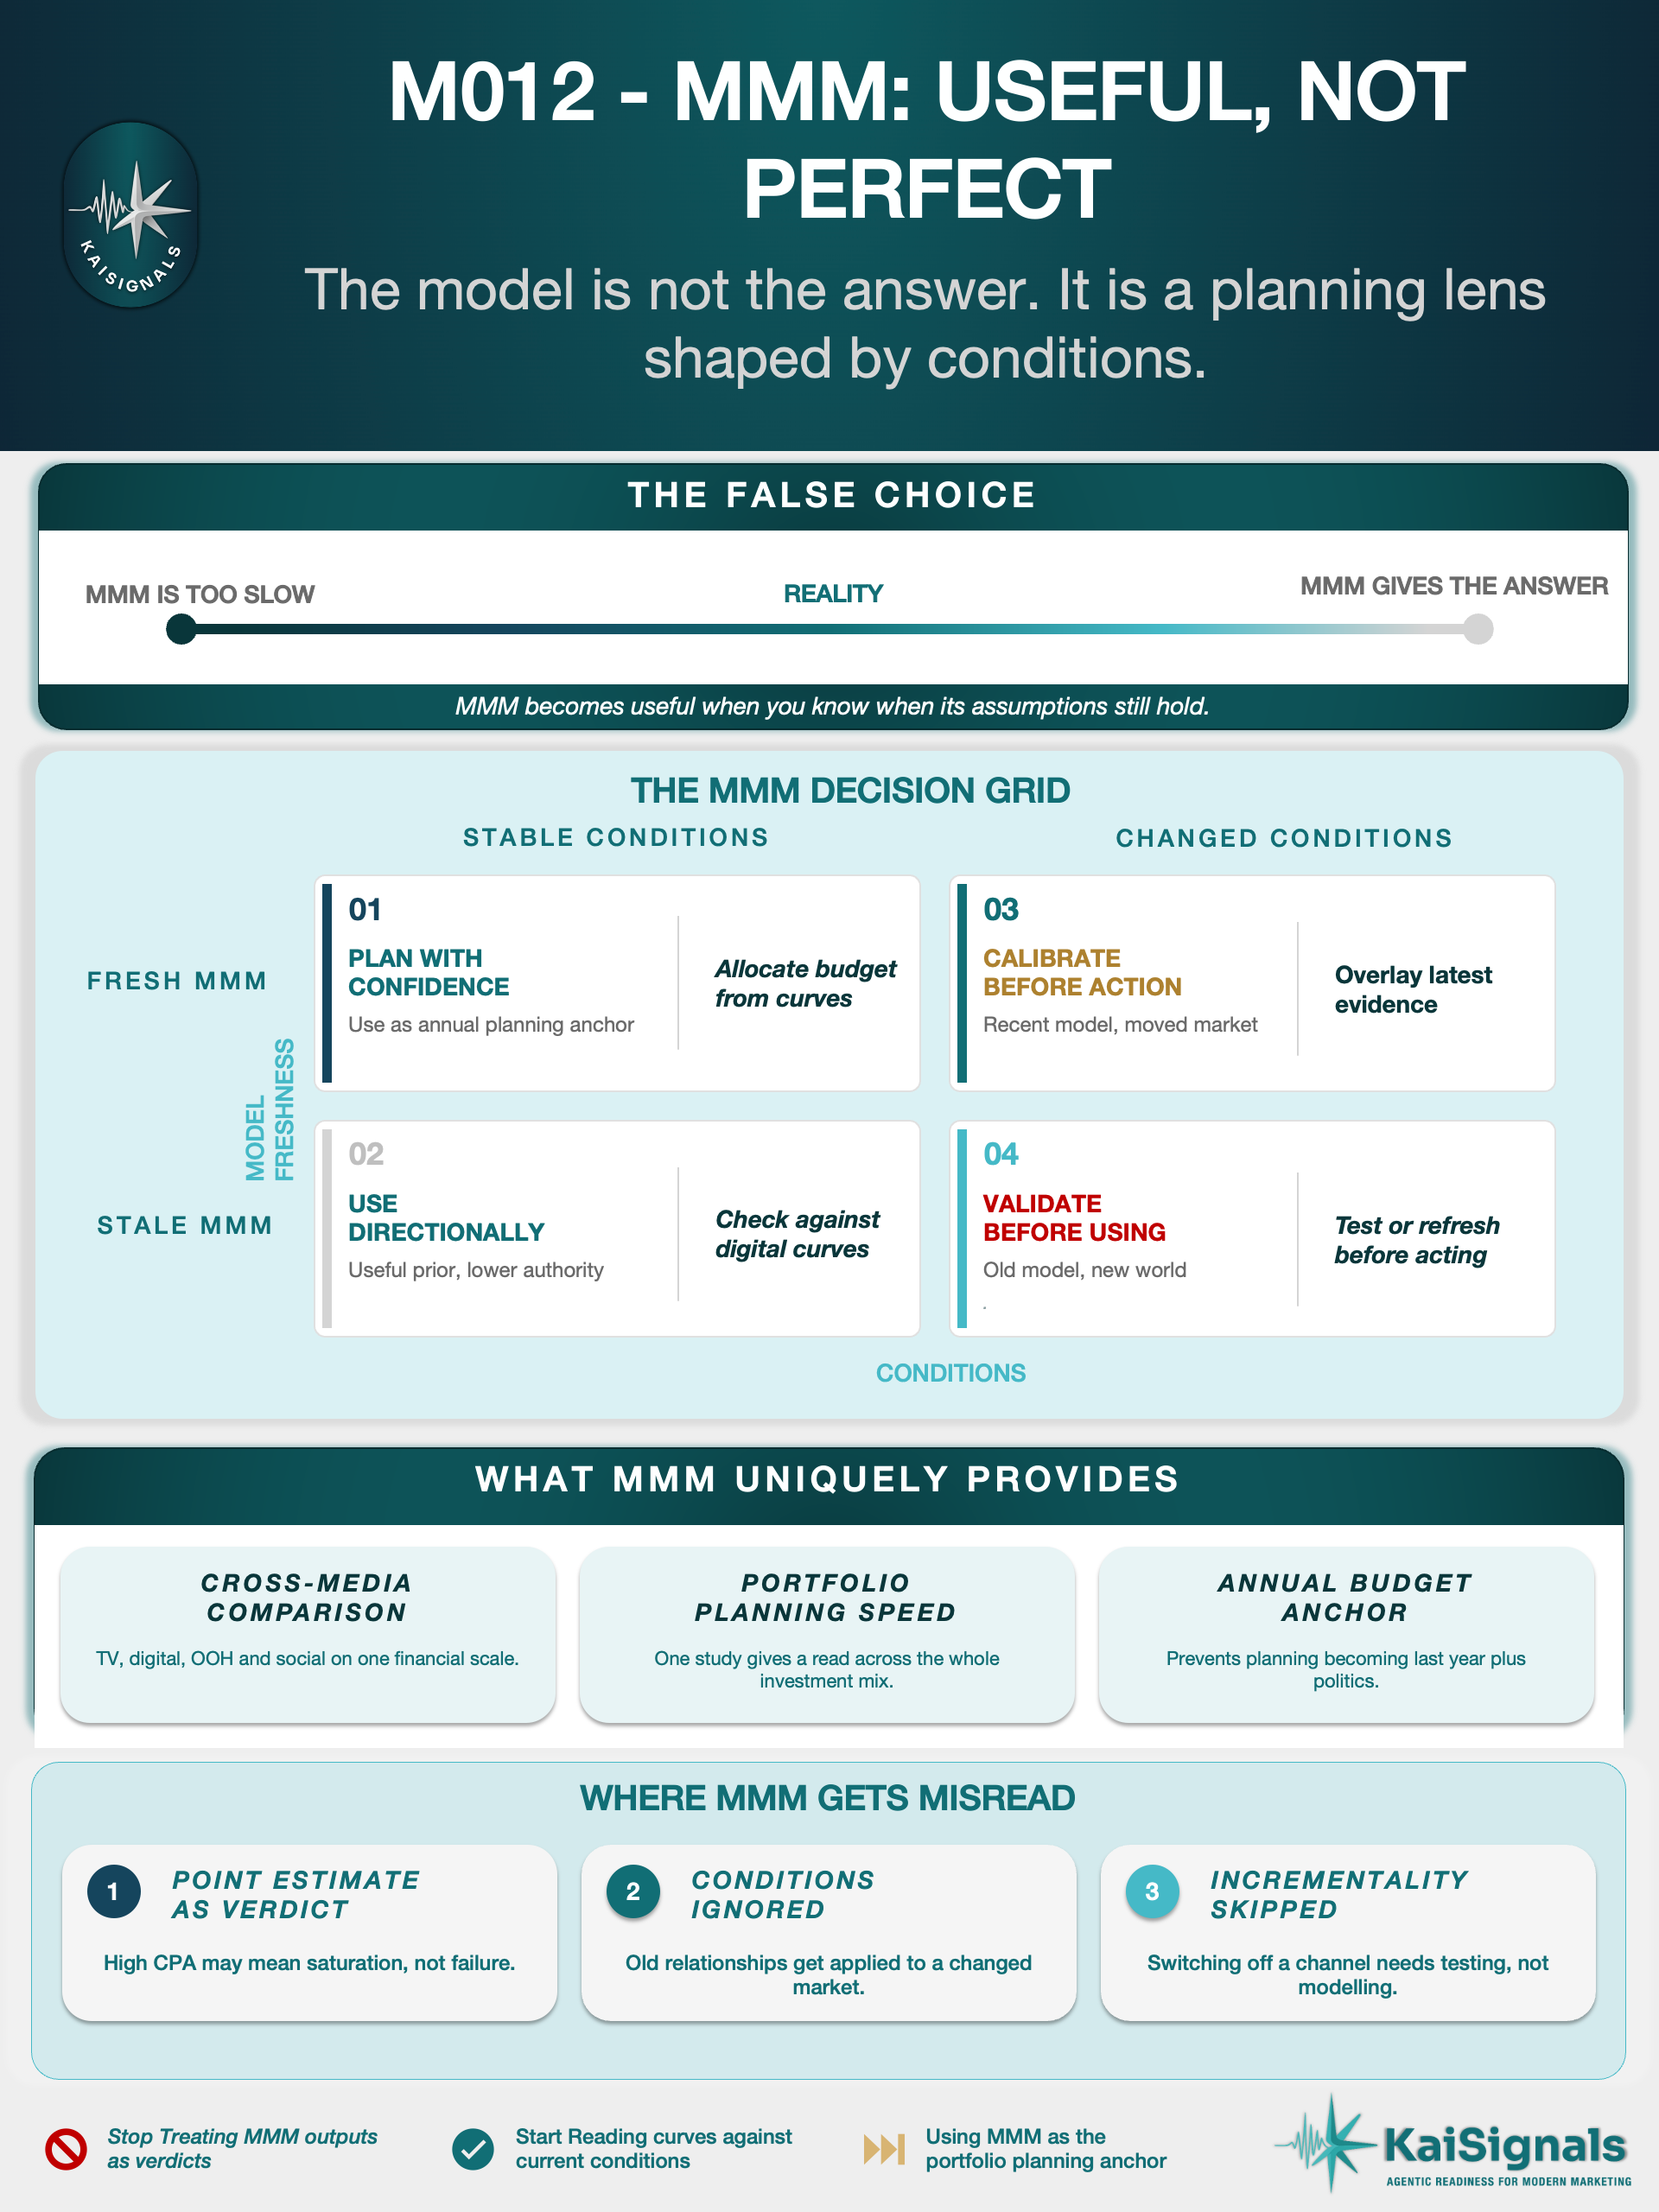
This is the tension at the heart of MMM. One camp says the model is too slow to be useful - the refresh is months old and the world has already moved. The other camp treats the output as the answer - if the model says display is expensive, move the money. Both are half right. The article’s job is to help the reader understand which situation they are in.
MMM sits inside the unified measurement model described in M006. It is one lens alongside attribution and incrementality testing, not a replacement for either. It operates under the same risk management principles covered in M009: commercial decisions made under uncertainty, with probability-adjusted thinking rather than false certainty.
This article is about what MMM does well, where it fails, and how to tell the difference in practice.

1. What MMM Tells You
MMM measures directional correlation between marketing variables and business outcomes across all channels - online and offline - over a defined period, under specific conditions.
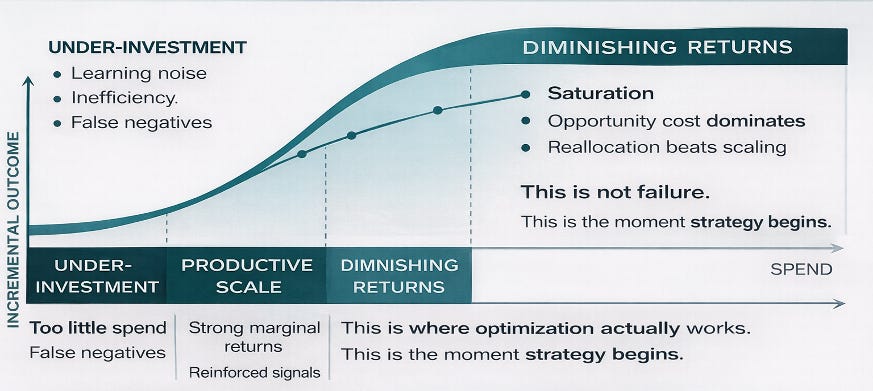
The output is a set of curves showing how each channel’s contribution changes with spend. Not a single number. Not a verdict. A shape. Each curve describes a relationship: at this spend level, this channel contributed this much. At a higher spend level, the contribution grew - but at a declining rate.
Reading MMM means reading those shapes. The shape tells you where you sit on the diminishing returns curve for each channel, which channels have headroom, and which are saturated. The number on its own, stripped of the curve, is close to meaningless.
2. The Three Things Only MMM Provides
There are three capabilities no other measurement method replicates.
The first is cross-media comparison. Attribution lives inside digital channels and has no way to compare TV against paid social against out-of-home on the same financial scale. Incrementality testing compares one channel at a time. MMM is the only method putting all channels into a single framework and evaluating them on the same terms.
The second is portfolio-level speed. Running incrementality tests across an entire media portfolio, one channel at a time, takes months or longer. MMM delivers a read across all channels in a single study. For organisations with complex media plans, this is not a convenience. It is the difference between having a view and not having one.
The third is the annual planning anchor. The budget question - “how should we be spending the marketing budget?” - needs a central, cross-channel study to ground it. Without MMM, planning defaults to last year’s plan plus or minus a percentage, adjusted by politics and recency bias. MMM sets the investment framework from which campaign development, creative strategy, and media planning build.
These strengths are real. They are also the reason people over-rely on MMM - because nothing else provides these three things, teams lean on it for questions it was never designed to answer.
3. The Conditions Assumption
This is the insight most readers miss.
Everything inside the model is measured. Everything outside the model is assumed constant. Campaign setup, competitive activity, pricing, promotional calendar, product launches - if they fall outside the modelled variables, they are treated as unchanged between the study period and the recommendation period.
When those conditions shift, the model does not know. It continues to report relationships learned under old circumstances. A pricing change, a new competitor entering the market, a shift in product mix - these do not get recalibrated until the next study. And even when the next study arrives, much of the new signal gets blended with older effects because of the requirement for longer data windows. The fresh signal is diluted by historical data.
This is the gap between what the model describes and what is happening now. In stable conditions, the gap is small and the output is reliable. In changed conditions, the gap widens and the output becomes directional at best, misleading at worst.
Understanding this distinction is the most commercially valuable thing a marketer or analyst learns about MMM.
4. When MMM Is Strong
A fresh MMM under stable conditions - similar pricing, similar promotions, similar competitive environment - is a strong planning tool. It gives close to the right answer for annual investment planning and budget allocation.
This is where the “gives you the answer” camp is right. The model is recent. The world it describes still broadly exists. The curves reflect current market dynamics. The relationships between spend and outcome are close to what they were when the model was built.
The conditions that make MMM strong: a refresh within the current or previous quarter, no material changes to campaign structure or product lineup, and a broadly stable competitive and pricing environment. When those conditions hold, MMM is the best planning tool available.
5. When MMM Misleads
In one econometric study, display came out with higher incremental CPAs than all other digital channels. The digital marketing lead read this as a clear signal: display is inefficient, move the money elsewhere.
Three failures layered on top of each other.
The high CPA at the reported spend level meant overinvestment, not a broken channel. The correct read was to bring spend down to a more efficient point on the curve. The model was showing saturation, not failure. But the point estimate was read as a verdict rather than a position on a curve.
A separate lift test had already shown display was genuinely incremental. The evidence was not integrated into the econometric model. Two measurement systems told different stories, and the simpler narrative won. The MMM said display was expensive. The lift test said display was incremental. The lead chose the number confirming the decision they wanted to make.
The money moved into other channels hit diminishing returns faster because those channels were already well invested. The net effect was worse portfolio efficiency, not better. A channel was switched off based on the wrong question, and the money moved into channels with less headroom.
The principle is clear. Switching off a channel is an incrementality question, not an MMM question. MMM shows the shape of the relationship at a given spend level. Only a lift test shows whether the channel generates incremental sales at all. The decision to switch off should follow from evidence of incrementality being too low relative to the minimum viable spend - not from a point estimate in an econometric model.
6. MMM as Scenario Simulator
MMM’s greatest operational value sits in two planning contexts.
The first is defensive. The budget is being cut and the team needs to find the least damaging place to take money out. The diminishing returns curves show which channels are deep into saturation, where pulling back costs the least in marginal return. This is not guesswork. The curves give a structured way to compare the cost of different cuts before money moves.
The second is offensive. At the start of the annual planning process, running allocation options through the model to compare outcomes before commitments are made. What happens if we shift 15% from linear TV to paid social? What happens if we increase investment in a new tactic showing early promise? MMM gives a structured way to run these scenarios at planning speed.
Both are planning-speed decisions. Neither is an in-week trading decision. This is where MMM excels - and where misuse begins when teams try to force it into a role it was not designed for.

7. MMM as Marginal Return Calculator
Growth curves are how MMM’s output becomes operationally useful.
In standard practice, digital curves are built from weeks of fluctuating spend data, fitted to log-curves, and used to calculate marginal ROI at the current spend level. MMM curves follow a similar shape but are derived from the econometric model rather than weekly calibrated data. Both produce the same output type: where on the diminishing returns curve each channel sits, and where the next pound delivers the most.
The marginal scenario framework asks a specific question. Given an extra increment of spend, which channel returns the most incremental profit at current investment levels? And conversely, if spend needs to come down, where does the last pound out cost the least?
This is the operational expression of MMM’s value. Not the headline number. Not the ranking of channels. The shape of the curve, the position on it, and the marginal cost or benefit of moving in either direction.
8. When MMM Is Unavailable: The Digital Curve Alternative
Not every organisation has a fresh MMM. Some have never commissioned one. Others have a study from eighteen months ago, predating a significant shift in media strategy or market conditions.
The hierarchy is straightforward. If a fresh MMM exists, use its curves as the primary planning input. If the MMM is stale or unavailable, digital curves built from weekly calibrated data become the backbone. These curves are calibrated with whatever recent evidence is available - whether experiment point estimates or directionally valid coefficients from the last MMM.
For channels without enough natural spend variation to build a digital curve, a three-point approach works. Run conversion lift studies at three different spend levels, each measured through an exposed versus unexposed design. Three points give a directional curve shape without needing months of organic spend fluctuation. This approach was developed for situations where the channel budget is too stable week-to-week to produce meaningful natural variation.
The calibration between MMM curves, digital curves, and experiment estimates is not ad hoc. It requires a codified system with explicit rules for how signals are weighted and reconciled. A signal authority hierarchy where experiment results take precedence over MMM coefficients, which take precedence over sector defaults. This is not judgement in the informal sense. It is judgement codified into a decision architecture.
9. Refresh Cadence: How Often Is Enough?
Industry standard is twice a year. Quarterly for organisations with the maturity and budget. More frequent than quarterly adds diminishing value - new data gets diluted by older trends, and the cost of each study erodes the return.
Cadence is not purely calendar-driven. The trigger for an unscheduled refresh is a meaningful change in conditions. A new campaign type, a significant pricing or promotional shift, a new product launch, a material change in media strategy. If nothing has changed, the existing model holds. If something meaningful has changed, waiting for the scheduled refresh means operating on broken assumptions for months.
A useful rule of thumb. Fresh and stable conditions: strong planning input. Stale but stable conditions: directional, with lower authority. Stale and changed conditions: validate before using, or do not use at all.
10. The Operating Rules
These are the principles I come back to every time an MMM output sits in front of a team making budget decisions.
Use MMM for annual planning and portfolio allocation, not in-week trading. The model operates at planning speed. Teams trying to force MMM into a weekly optimisation role are misusing a strategic tool for a tactical question.
Read the curve shape, not the point estimate. The same channel looks efficient at low spend and inefficient at high spend. A high CPA is not a failed channel. It is information about where the channel sits on its diminishing returns curve.
Never switch off a channel on MMM evidence alone. Switching off is an incrementality question. It requires evidence the channel does not generate incremental outcomes at any reasonable spend level. MMM does not answer this question.
Know the conditions under which the model was built and what has changed since. If conditions have shifted, the model’s recommendations describe a market no longer in existence.
When MMM is stale, fall back to calibrated digital curves with the latest available evidence. The hierarchy is codified, not improvised: experiments take precedence over model coefficients, which take precedence over default assumptions.
Calibrate between signals through a system, not instinct. The moment calibration becomes informal, the loudest voice or the most convenient number wins.
The Model and the System
MMM is the most strategically valuable measurement tool most organisations will commission. It is also one of the most frequently misread.
Its value is not in the numbers it produces. Its value is in the shape of the relationships it reveals - relationships that hold under specific conditions, for a specific period, at a specific level of investment. Reading those shapes correctly, and knowing when they no longer apply, is the skill that separates useful planning from expensive mistakes.
The model is not the answer. It is a planning lens shaped by conditions. The moment those conditions change, the lens needs recalibrating. The moment the model is treated as a verdict, it stops being useful and starts being dangerous.
The next article in this series looks at attribution - the measurement tool operating at the opposite end of the spectrum. Where MMM is slow, strategic, and cross-media, attribution is fast, granular, and structurally limited to what it observes. The same discipline applies: understanding what it tells you, what it does not, and where the boundaries sit.
If you are trying to translate these mental models into operating systems that run day to day, this is the problem KaiSignals works on.