
M015 - Triangulating Truth: Why Three Methods Beat One
Four methods, one system, and the discipline connecting them.


Getting to the Destination
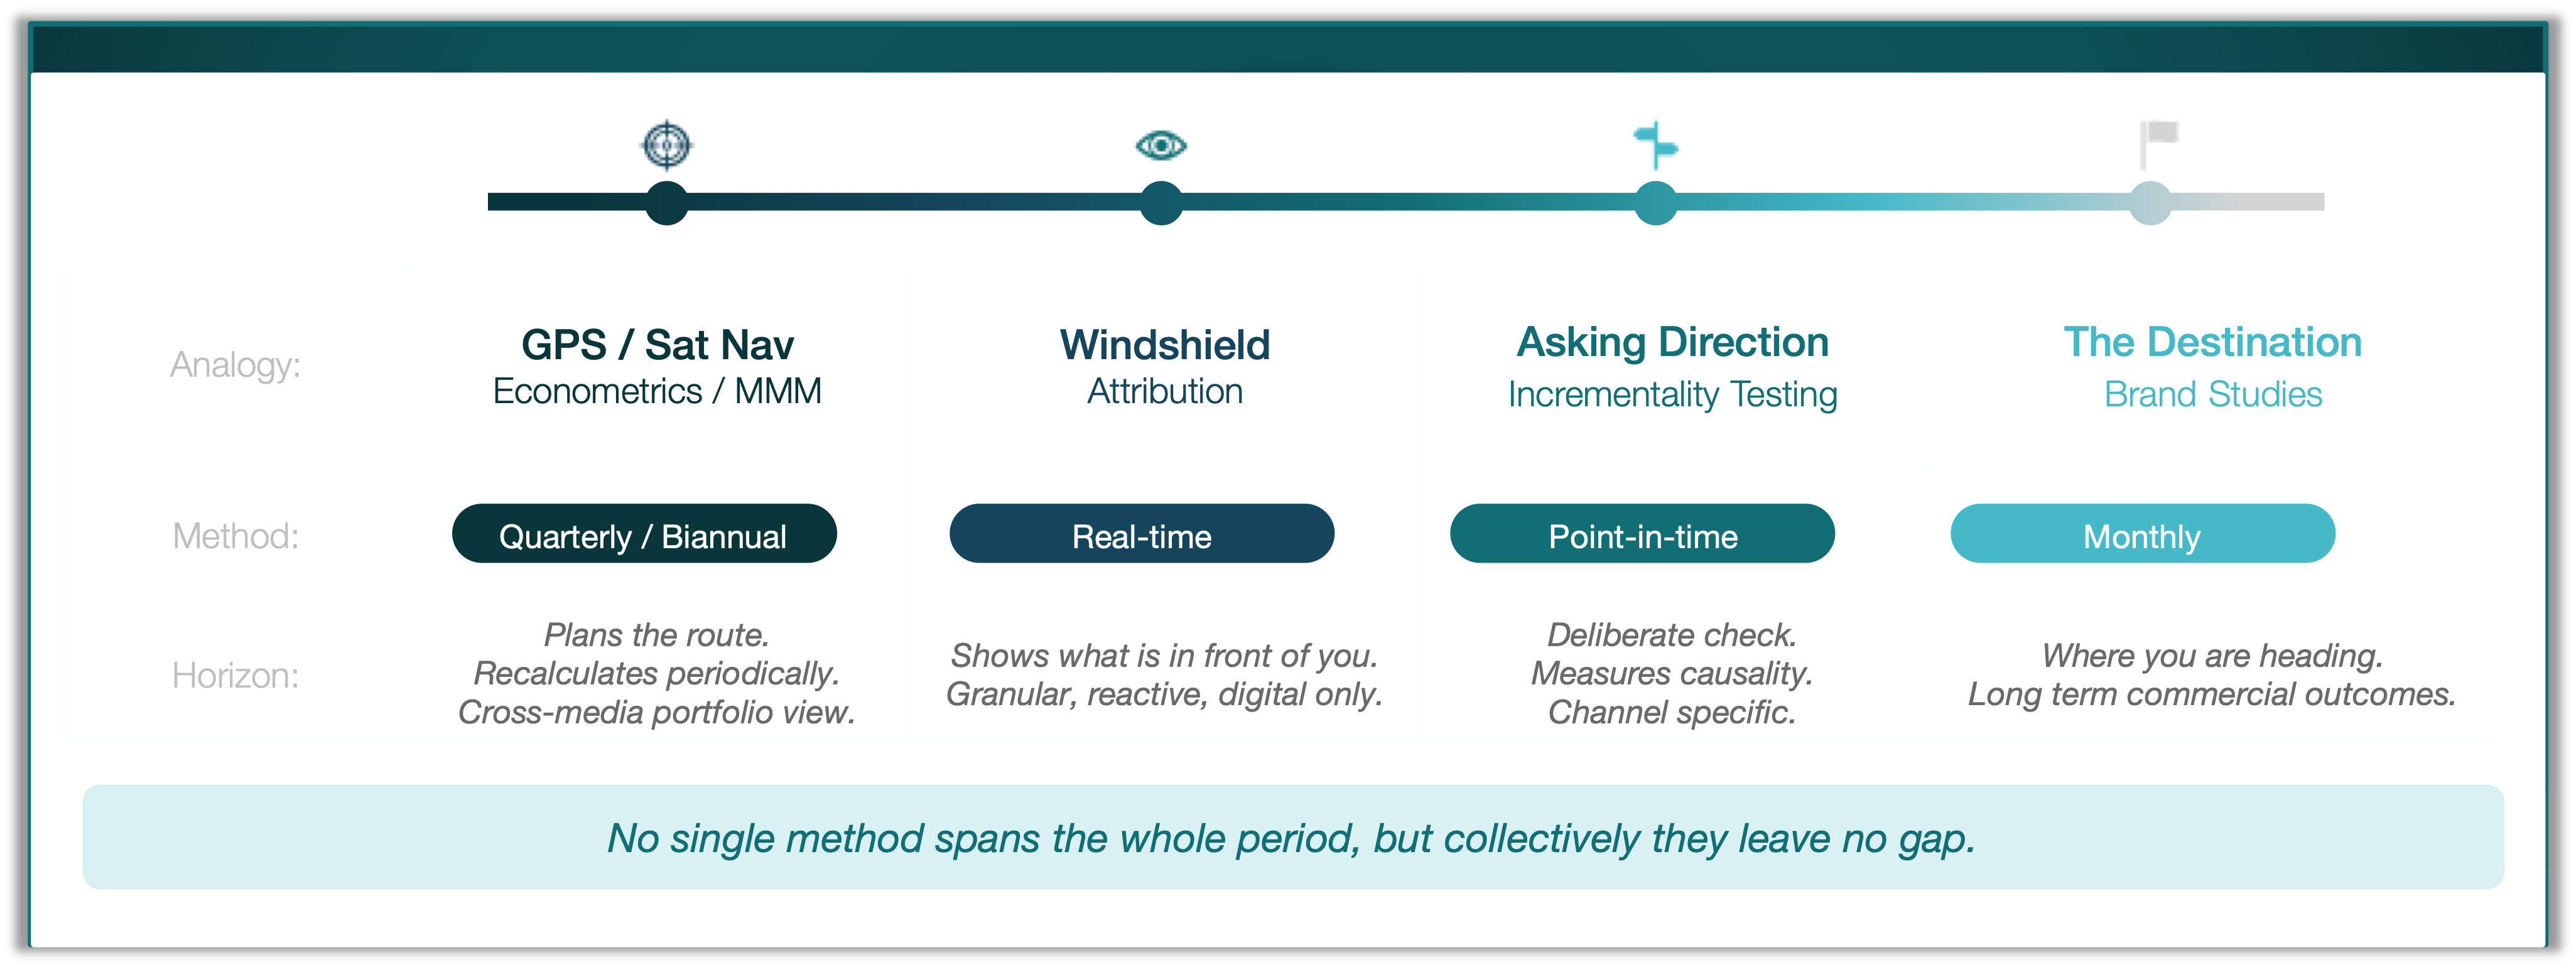
In M012, we looked at MMM as the GPS of media measurement. It plans the route. It accounts for the terrain, the weather, and the conditions around you. It recalculates periodically. But it does not update in real time, and it does not always have the latest road information.
In M013, we looked at attribution as the windshield. It shows the traffic, the pedestrians, the movement ahead. It lets you steer. It lets you react. But the windshield only shows what is directly in front of you. It does not tell you whether you are on the right road.
In M014, we looked at incrementality testing as the act of pulling over to ask for directions. A deliberate pause. A point-in-time check. You stop the car, step outside, and ask a question that neither the GPS nor the windshield answered.
This article adds the fourth element: the destination.
Brand health and brand equity represent where you are heading. Profit. Revenue. Long-term commercial value. Without a destination, the GPS, the windshield, and asking directions are all meaningless activity. You are driving, but you do not know where.
When all four elements work together, you are not running four separate measurement methods in parallel. You are driving one car toward one destination. The GPS plans the route. The windshield shows what is happening now. You pull over to check when the GPS is outdated or the road is unfamiliar. And the destination is the reason you are driving at all.
This is not a metaphor bolted onto the measurement stack. It is a direct relationship. And the question this article answers is not whether you need all four. If you have read M012 through M014, you already know you do. The question is how to make them work as a single system.
(For the individual method foundations, see M012 on MMM, M013 on attribution, M014 on incrementality. For the unified measurement model that underpins this framework, see M006.)
The Measurement Maturity Ladder
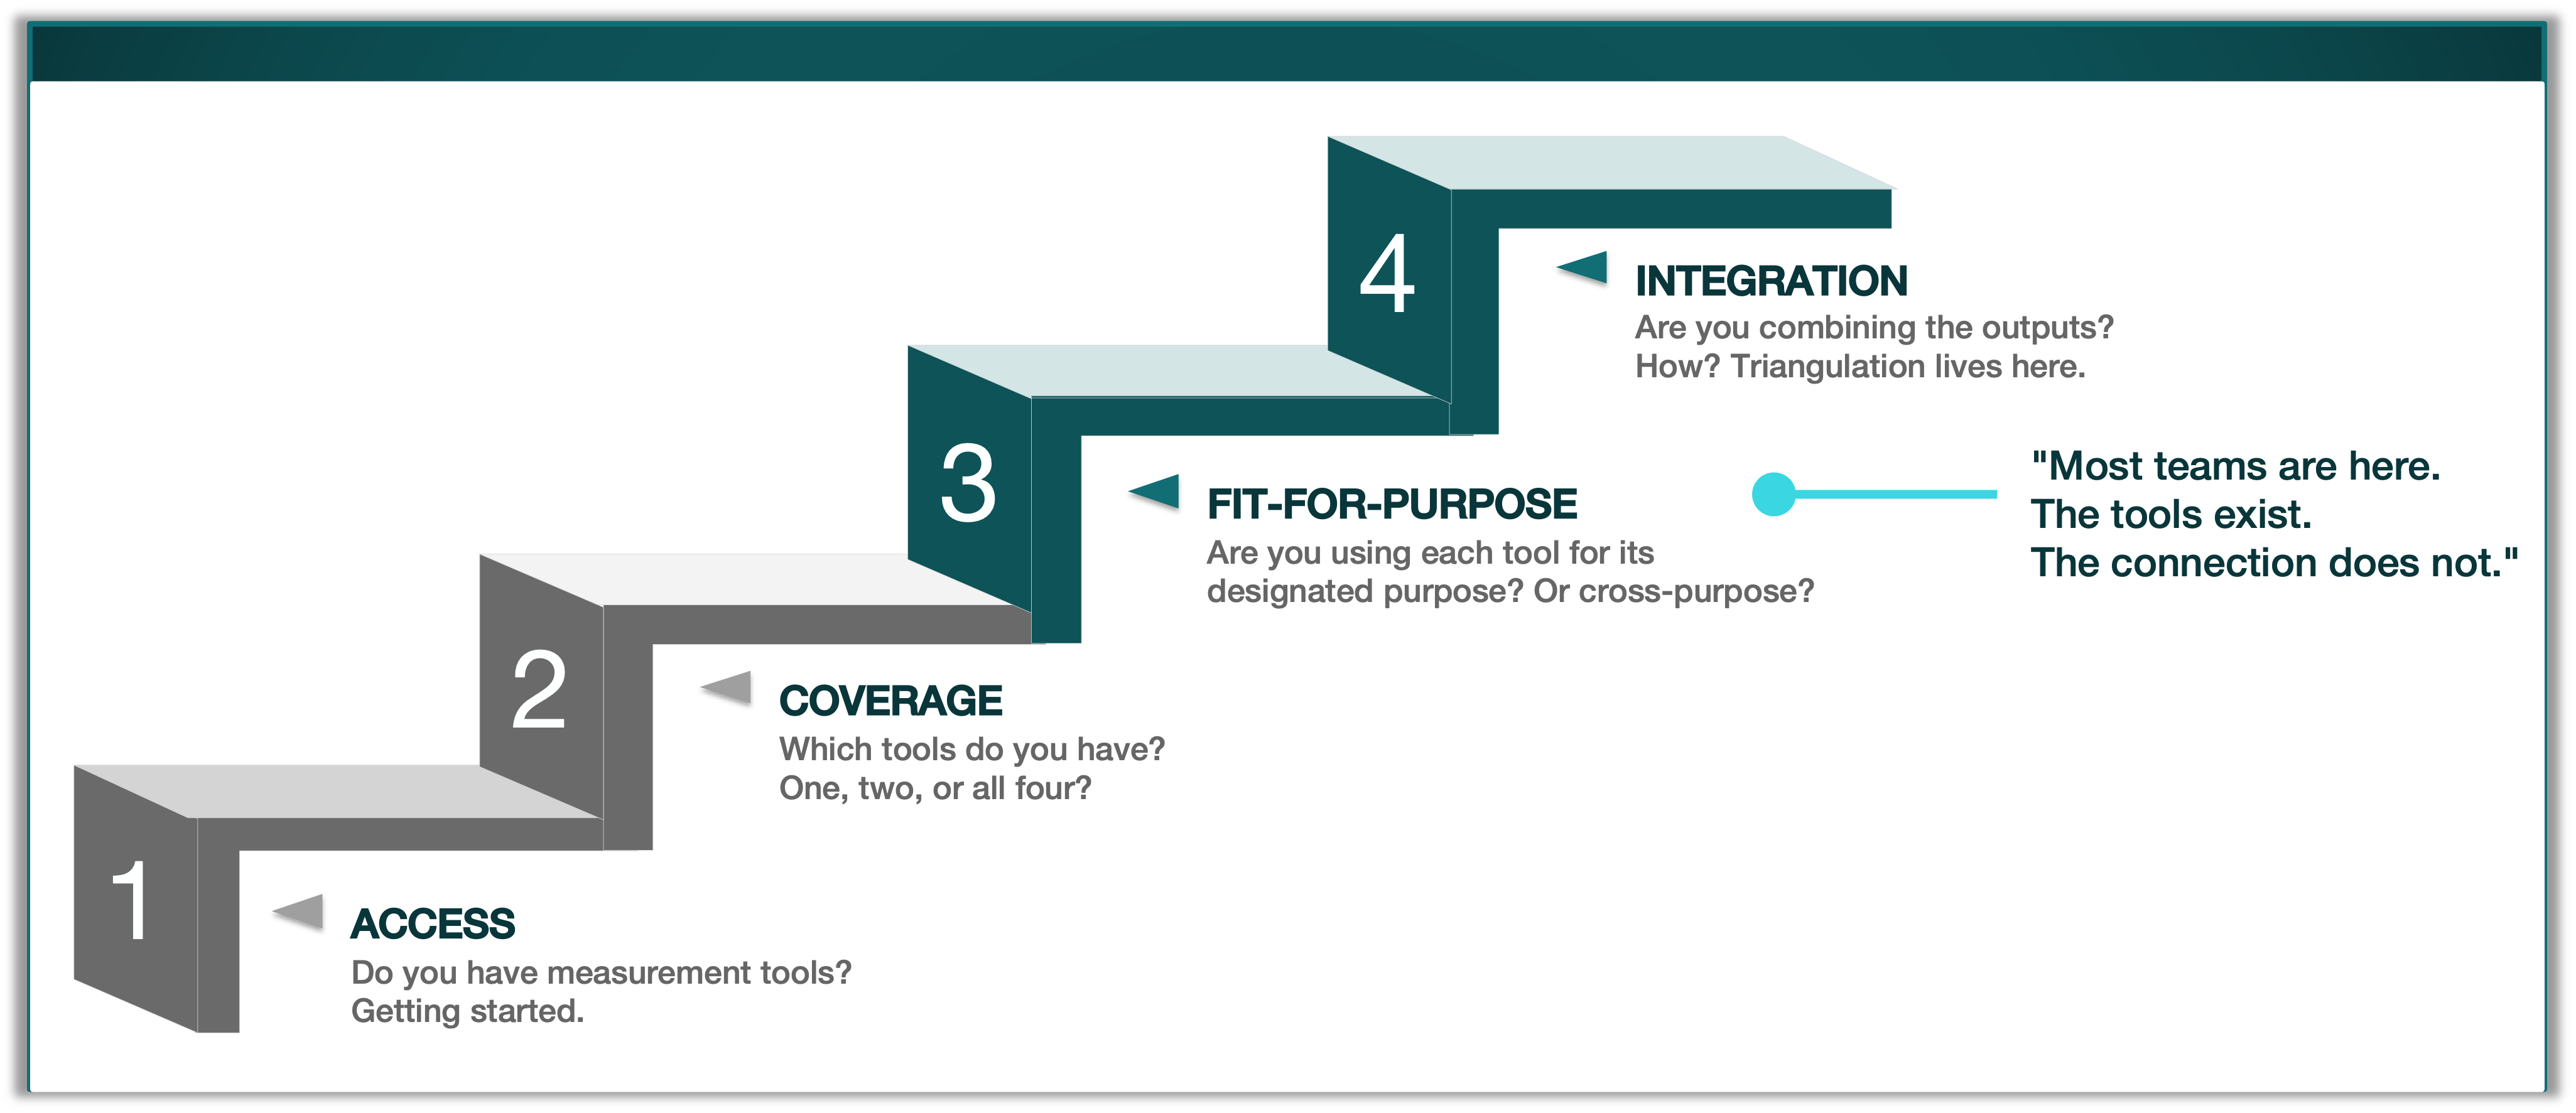
Before we get into how the methods connect, it is worth acknowledging most teams are not ready for triangulation. Not because they lack intelligence or ambition. Because the problem has multiple stages, and you need to clear each one before integration becomes meaningful.
Stage 1: Access. Do you have any measurement tools at all? For many small and mid-sized businesses, this is the starting point. They are running digital campaigns with platform reporting and nothing else. The work here is choosing the first tool and building the first baseline.
Stage 2: Coverage. Which tools do you have? One? Two? All four? At this stage, teams have started investing in measurement capability. They might have attribution and an annual MMM study, or they might be running lift tests alongside platform reporting. The question is whether they have enough instruments to see more than one part of the picture.
Stage 3: Fit-for-purpose. This is where most large enterprises sit. They have bought the tools. They are using them. But are they using each tool for its designated purpose? Or are they using attribution to answer questions belonging to MMM? Treating a single lift test result as a standing truth? Making budget decisions on raw platform-reported CPAs without any incrementality correction?
The misuse patterns at this stage are well documented across this series. M010 showed how measurement misleads when confident answers come from flawed frames. M012 showed how MMM coefficients get misread as tactical levers. M013 showed how attribution’s reward system problem programs platform AI to intercept demand rather than generate it. M014 showed how narrow test interpretation leads to underinvestment in the channels with the most headroom.
Stage 4: Integration. Are you combining the outputs, and how? This is where triangulation lives. The final stage. Not an upgrade. The destination.
Different businesses at different scales sit at different stages. SMEs are working through stages 1 and 2. Mature companies with long histories of measurement investment often find themselves at stage 2 or 3, not because they started late but because the tools were built in silos and never connected. Large enterprises with dedicated econometrics teams, experimentation programmes, and digital attribution infrastructure sit at stage 3 or are actively working toward stage 4.
If you are reading this series, you are most likely at stage 3. You have the tools. You are using them. The question is whether they are talking to each other.
What Each Method Gives You (and What It Does Not)
We have covered each method in detail across the last three articles. The purpose here is not to repeat those arguments but to show the specific gap each method leaves open. Because the case for triangulation is not philosophical. It is structural. Each method’s blind spot is another method’s strength.
Econometrics / MMM gives you the cross-media portfolio view. It measures directional correlation between marketing variables and outcomes across channels, including non-digital. It accounts for seasonality, promotions, pricing, and external factors. But it is slow. Quarterly or biannual at best. And it operates at aggregate level. It cannot isolate a specific tactic or creative variant with certainty.
Attribution gives you granularity and speed. It measures credit distribution within the observed digital path in near real-time. It lets you steer week to week. But it is structurally blind to incrementality. It does not see non-digital channels. And it does not account for external factors like seasonality or promotions.
Incrementality testing gives you measured causality. It answers the one question the other methods cannot: would this outcome have happened without this intervention? But it is point-in-time. It tells you about one channel, one tactic, one moment. It does not generalise across the portfolio. And it requires deliberate design, budget, and patience.
Brand studies give you the forward-looking signal. They measure the impact on awareness and consideration, which convert into sales and revenue in the long run. But they have no direct relationship with short-term sales. They tell you whether you are building the conditions for future returns. They do not tell you what this week’s numbers look like.
No single method spans the full commercial time horizon. Attribution covers today. Incrementality testing covers a specific measured point. MMM covers the quarterly or biannual view. Brand studies cover the 6-12 month forward-looking signal. Put them together and there is no gap. Run them separately and each one is operating partially blind.
The Hierarchy: Which Signal Wins
When you have multiple methods giving you information, you need a rule for what happens when they disagree. That rule is the signal authority hierarchy:
Experimentation > MMM > Attribution
Experimentation sits at the top because it measures causality directly. A well-designed test isolates the effect of a specific intervention and tells you, with statistical confidence, what the intervention caused. No other method does this.
MMM sits above attribution because it sees the full portfolio and controls for external factors. It accounts for seasonality, offers, pricing, competitive activity. Attribution does not. When the two point in different directions, MMM is more likely to be reflecting reality because it is working with a more complete picture.
Attribution sits at the base. Not because it is unimportant. As M013 argued, attribution is foundational. It is the operational infrastructure that platform targeting and optimisation run on. But its structural limitations - digital-only visibility, no incrementality, no external factor control - mean it carries the least authority when the signals conflict.
This hierarchy is not about which method is best. It is about which signal carries the most weight when they disagree. And the distinction matters: the hierarchy is the governance rule. It resolves conflict. The integration flows described in the next section are the operating mechanism. They keep the system calibrated between conflicts.
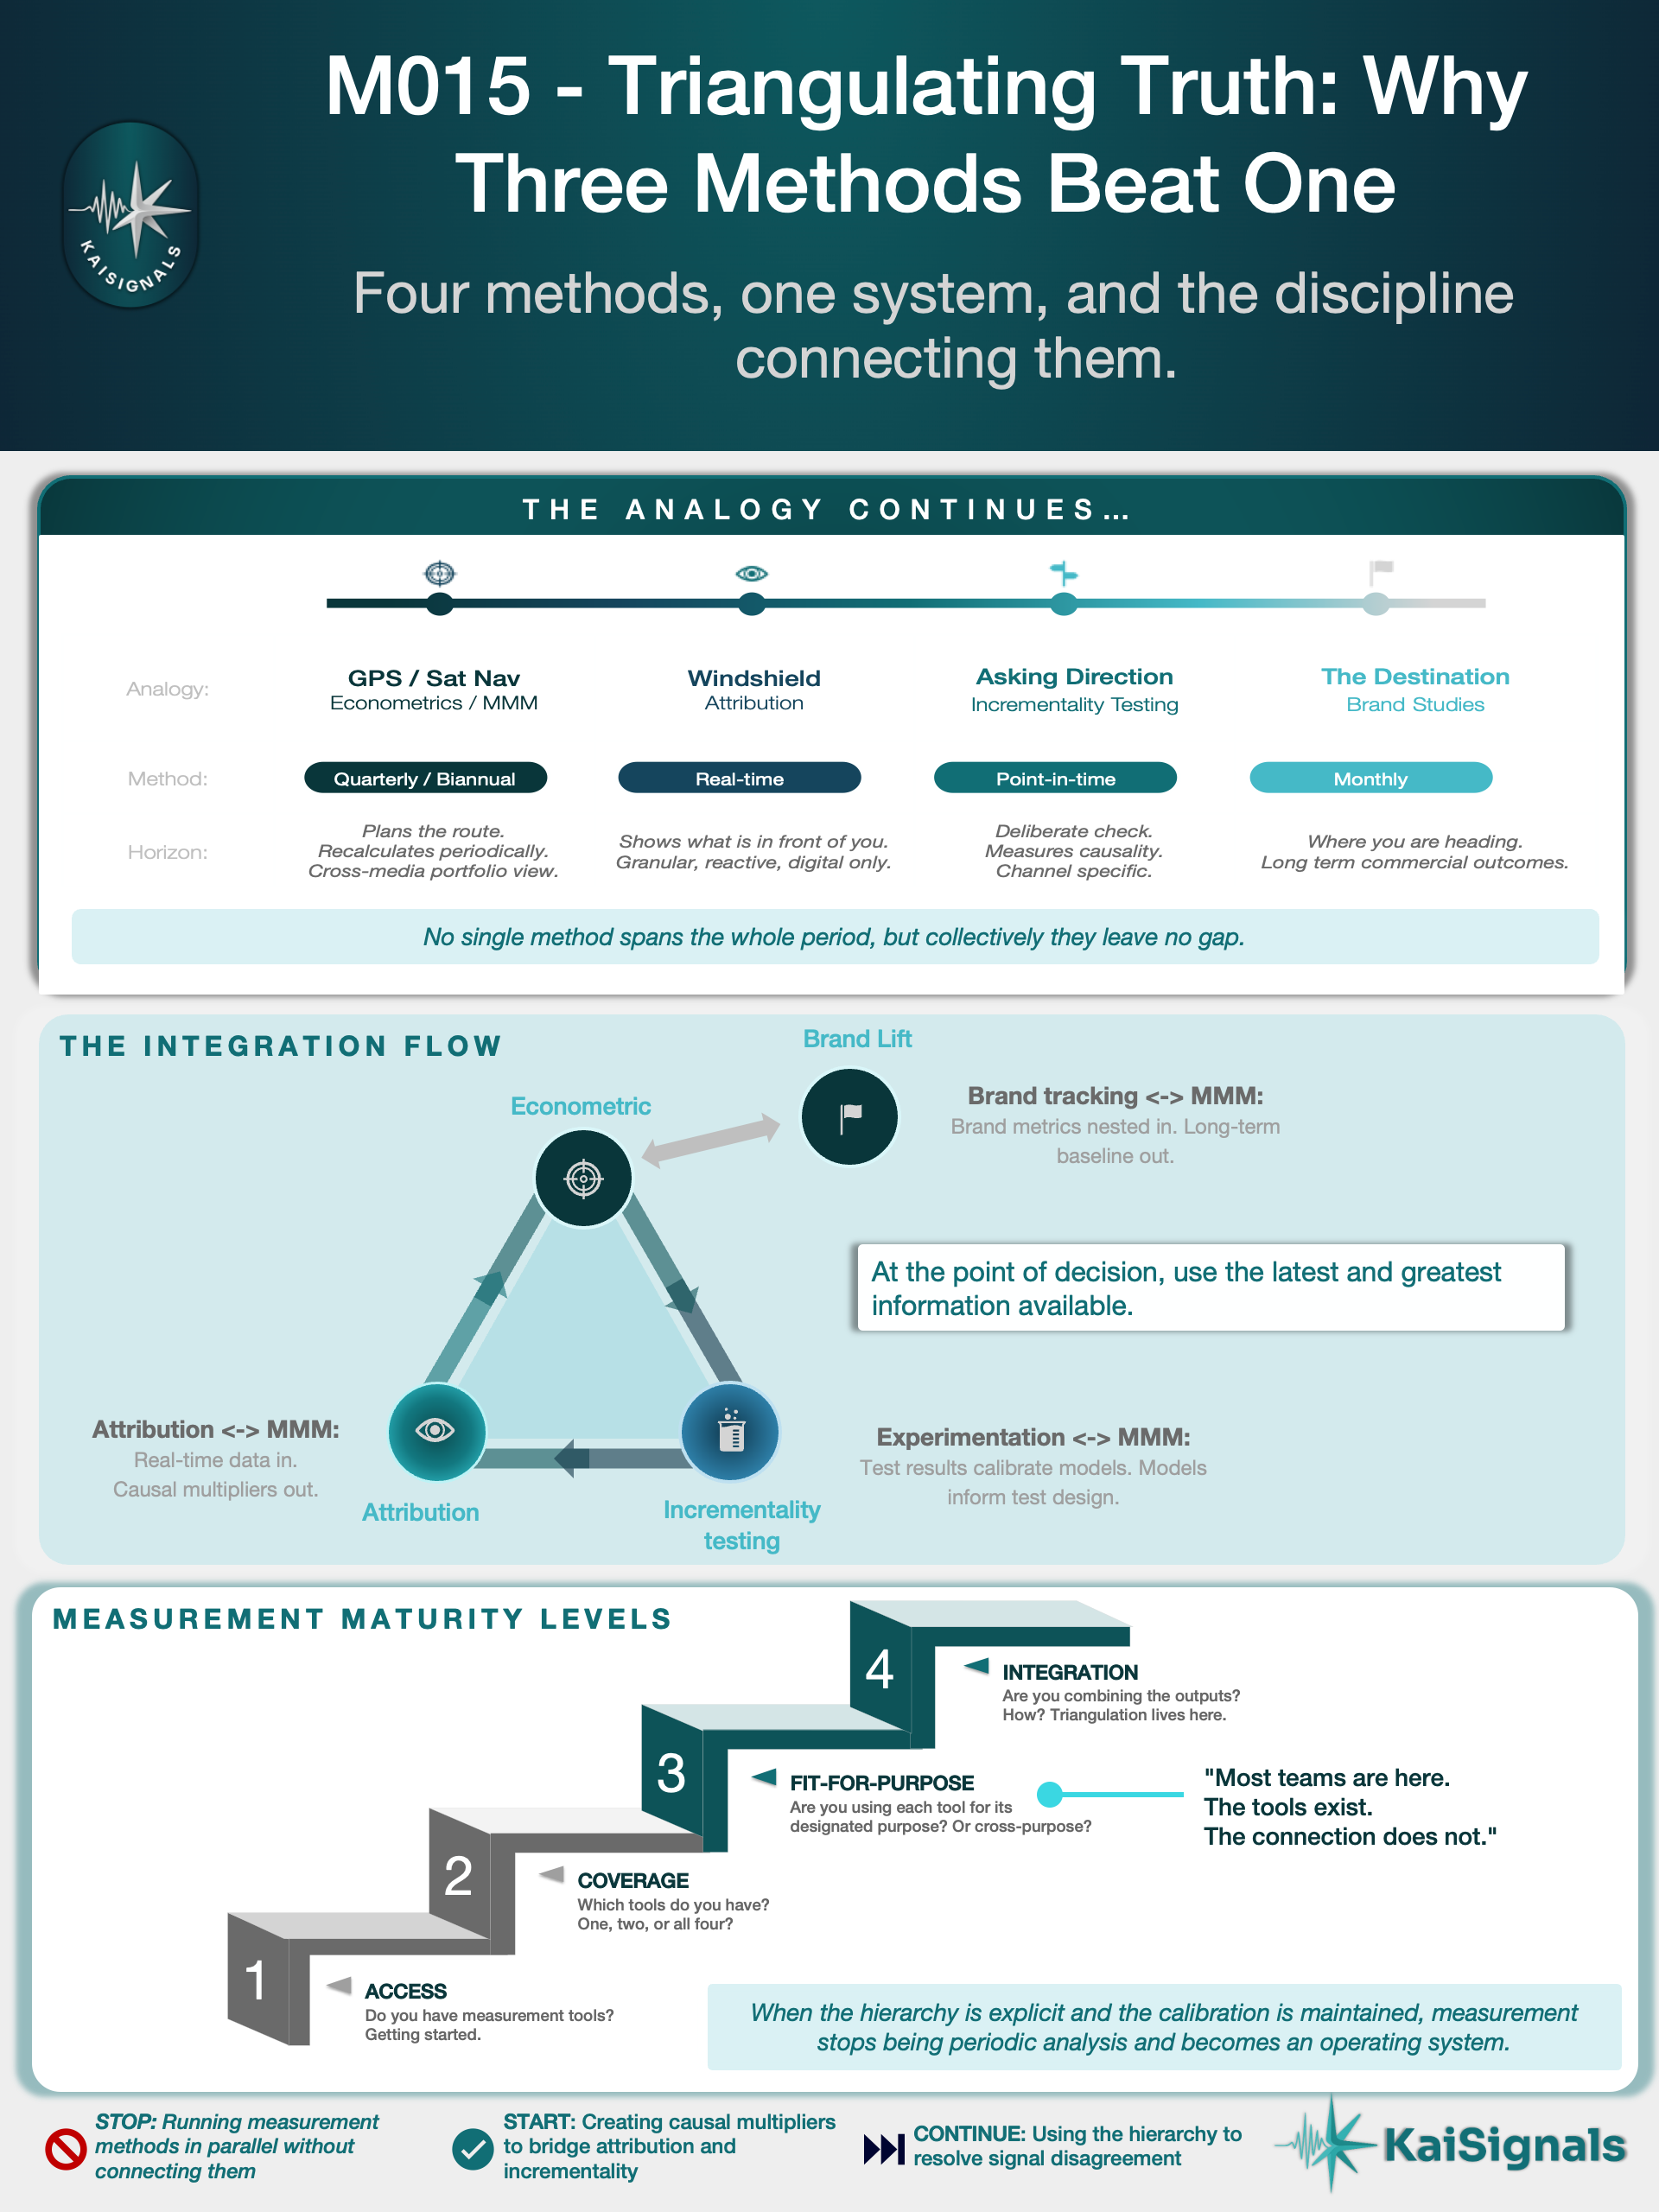
The Integration Flows: How the Methods Talk to Each Other
The hierarchy resolves disagreement. But most of the time, the methods are not disagreeing. They are feeding each other. The day-to-day operating mechanism of a triangulated measurement system is not conflict resolution. It is continuous calibration.
Three key flows make this work.
Attribution and econometrics. Attribution sends real-time, granular digital data into the econometric model as an input. In the other direction, econometrics sends back incrementality overlays: response curves from the model combined with the real-time digital data, so daily digital reporting is read in the currency of incrementality rather than raw attributed credit. This is the causal multiplier at work, and the next section covers it in detail.
Experimentation and econometrics. Test results calibrate econometric models and set Bayesian Priors. When you run multiple tests across different product areas and channels, the results build into what some teams call “Golden Rules” - empirically validated coefficients that are embedded directly into the econometric model. In the other direction, econometricians use model outputs to suggest ideas for tests. Where the model shows uncertainty or weak coefficients, experimentation is designed to fill the gap. Expected media effectiveness uplifts from the model are used to conduct power analysis and help design tests large enough to detect real effects.
Brand tracking and econometrics. Brand equity measures are nested into the commercial econometric models. This is a specific modelling technique: brand metrics are modelled first in their own right, and the outputs are then incorporated as variables in the commercial model. This quantifies how a shift in brand metrics - a percentage point improvement in consideration, a movement in awareness - translates to commercial outcomes. Some of this impact materialises in the short term. The rest shows up as a shift in the long-term baseline. This is how the system accounts for marketing activity that builds value slowly rather than converting immediately.
Econometrics acts as the integrating layer. It is the common currency through which the other three methods are expressed and reconciled. This is not a design choice. It is structural. Econometrics is the only method that operates across the full media portfolio, accounts for external factors, and has the mathematical architecture to absorb inputs from the other three.
The Causal Multiplier: Bridging Attribution and Incrementality
This is where the system becomes tangible for the practitioner who reads attribution data every week.
The causal multiplier is the ratio between what attribution reports and what is incrementally true. It is the same concept as the attribution-to-incrementality ratio introduced in M013. Two sources feed it:
From econometrics: response curves from the model combined with real-time digital data. This produces a standing correction translating attributed performance into incremental terms.
From incrementality testing: the measured incremental result at a specific point in time compared to what attribution reported for the same activity over the same period. This produces a direct ratio for that channel, that tactic, that moment.
Both sources are treated the same way. The ratio between attributed and incremental value at a given point gives you the multiplier. Apply it to daily attribution data and you have a calibrated view of digital performance.
Here is where the discipline becomes demanding. Causal multipliers are not always stable. Attribution does not account for seasonality, offer, price, or promotion. Econometrics and testing do. So when external conditions shift - a seasonal peak, a price change, a promotional burst - the attributed performance changes but attribution does not know why. The econometric or test-derived view adjusts for these factors. The other side of the ratio does not. So the multiplier moves.
This is not a flaw. It is a structural feature of the system. Attribution and econometrics are measuring different things. Only one of them adjusts for external conditions. The implication is clear: recalibration is required every time a new econometric study or incrementality test completes. This is not optional maintenance. It is a structural requirement.
One more nuance. When the causal multiplier comes from incrementality testing rather than econometrics, it is channel-specific. A test tells you about that channel, that activity, at that point in time. It does not generalise across the portfolio. So you prioritise testing on the channels where you overinvest, because that is where calibration carries the most commercial weight. A 5% correction on a channel receiving 40% of your budget moves more money than a 20% correction on a channel receiving 3%.

When Signals Diverge
The hierarchy exists for a reason. But in practice, true signal conflict - one method says stop, another says go - is rare.
The more common pattern is signal divergence. The methods point in the same direction but at different magnitudes. Digital attribution suggests higher spend levels than the econometric view. This is structural, not a conflict. Attribution has more granular information. It sees each channel individually and makes a case for each one independently. The sum of all those individual recommendations adds up to more than the econometric portfolio view. Because attribution is unconstrained. Econometrics is portfolio-constrained. It knows total budget is finite and allocates accordingly.
When genuine conflict does occur, it tends to be a portfolio question rather than a channel question. Is a specific digital channel the most efficient place to invest, or are there non-digital alternatives that deliver better marginal returns? Attribution cannot answer this question. It only sees digital. MMM sees the full media mix. The hierarchy resolves it: econometrics sets the envelope, attribution allocates within it, and experimentation adjudicates specific questions when the stakes justify the cost of a test.
The practical resolution is straightforward. At the strategic level, the cross-media investment decision is defined by econometrics. The digital components within that envelope are calibrated with the latest attribution data and the most recent causal multipliers. If a test has been run for a relevant channel, that test result shapes the decision for that channel. Brand health signals inform whether the overall direction of travel is sound.
This is not a quarterly exercise. It is continuous. The discipline is knowing which signal is freshest and most relevant for the specific decision being made.
Brand Studies: The Destination Signal
Brand studies sit in the system differently from the other three methods. MMM, attribution, and incrementality testing all measure what has happened or what is happening. Brand studies measure what is coming.
The mechanism is specific. Brand health modelling uses respondent-level brand tracking data combined with media consumption information to build models on key KPIs: awareness, consideration, brand associations. These brand metrics are then nested into the commercial econometric models. The nesting quantifies how a shift in brand metrics influences the long-term baseline of commercial outcomes like sales and churn.
A percentage point improvement in consideration translates to X sales outcomes. Some of the X arrives in the short term. The rest shifts the long-term baseline upward. This is how the system captures the value of brand-building: investment not converting immediately but building the conditions for future commercial returns.
Brand tracking also acts as a leading indicator. It gives you an early signal of how a campaign is performing on awareness and consideration before the sales data arrives. If brand metrics are moving in the right direction, you have confidence that the commercial outcome will follow. If they are softening, you have an early warning - one that arrives before the sales numbers turn.
The critical limitation is clear. There is no direct relationship between the brand study panel and short-term sales performance. Brand studies tell you whether the destination is getting closer or further away. They do not tell you what this week’s sales look like.
This completes the time horizon picture. Attribution gives you today. Incrementality testing gives you a measured answer at a specific point. MMM gives you the quarterly or biannual view. Brand studies give you the 6-12 month forward-looking signal. Four methods. Four time horizons. Full commercial coverage from the daily steering decision to the long-term strategic trajectory.
Where to Start: The First Calibration
If you are at stage 3 - tools in place, not yet connected - the question is where to begin. The answer depends on which tools you have.
If you have econometrics and attribution: the first step is creating causal multipliers for your attribution data. Take the econometric response curves and apply them to your real-time digital reporting. The goal is to read attribution in the currency of incrementality rather than raw attributed credit. Once you have this bridge in place, every weekly performance review becomes a calibrated view rather than an attributed guess.
If you have experiments and econometrics: the first step is getting test results into your econometric model. Use the results to calibrate coefficients, set Bayesian Priors, and start building Golden Rules from repeated tests across product areas. In the other direction, use the model to inform which tests to run next and to provide the expected uplifts needed for power analysis.
These paths are parallel, not sequential. You do not need to complete one before starting the other. The system builds outward from whichever pair you establish first. The second connection follows naturally. And the third - brand tracking nested into the econometric model - is a modelling exercise that the econometrics team undertakes as part of their regular model refresh.
The point is this: you do not need to build the entire system before you start getting value from it. Each connection between two methods improves the quality of decisions immediately. The full system is the end state, not the starting condition.
The Operating Principle
There is a temptation to turn triangulation into a calendar-driven process. Quarterly syncs where all the measurement teams present their findings, debate the differences, and agree on a unified view.
That is not how it works in practice.
The operating principle is simpler and more demanding: at the point of decision-making, use the latest and greatest information available across all methods.
A strategic cross-media investment decision is defined by the most recent econometric study. The digital components within that decision are calibrated with the latest attribution data and the most recent causal multipliers. If a test has been run for a relevant channel, that test result shapes the decision for that channel. Brand health signals inform whether the overall direction of travel is sound.
The decision does not wait for all four methods to sync up. The cadence of each method is different. Attribution runs daily. Brand tracking reports monthly or weekly. Econometrics refreshes quarterly or biannually. Test results arrive 2-6 weeks after each experiment concludes. These rhythms are staggered by design. The discipline is knowing which signal governs which decision at which moment - and trusting the hierarchy when they disagree.
This requires something tools alone cannot provide. It requires the teams and the leadership to be comfortable with the operating model. Without that comfort, teams default to whatever signal is most familiar or most frequent. And the most frequent signal is usually attribution - which, as the hierarchy makes clear, carries the least authority.
When the hierarchy is explicit, the multipliers are maintained, and the recalibration triggers are defined, measurement stops being periodic analysis. It becomes an operating system. Not a report that arrives quarterly. A discipline that runs continuously and shapes every capital allocation decision in near real-time.
That is what integration looks like at stage 4.
The System Is the Method
We have spent four articles looking at measurement methods individually. MMM for the route. Attribution for the road. Incrementality for the checkpoints. Brand health for the destination. Each is useful on its own. Each is limited on its own.
The system is what makes them useful together.
The hierarchy resolves disagreement. The integration flows maintain calibration. The causal multiplier bridges real-time attributed data and incremental truth. Brand health tells you whether the destination is getting closer or further away. And the operating principle - use the latest and greatest at the point of decision - turns what would otherwise be a collection of periodic reports into a continuous discipline.
This is what Chapter 4 has been building toward. Not a recommendation to buy more tools. A framework for connecting the tools you already have into a system that governs how capital moves.
The next chapter opens different territory. The methods described here were designed for a world where humans interpreted the signals and made the decisions. Platform AI is changing that equation. M016 picks up where the platforms take over.
If you are looking to connect your measurement tools into a system that governs how capital moves, this is the problem we work on at KaiSignals.