
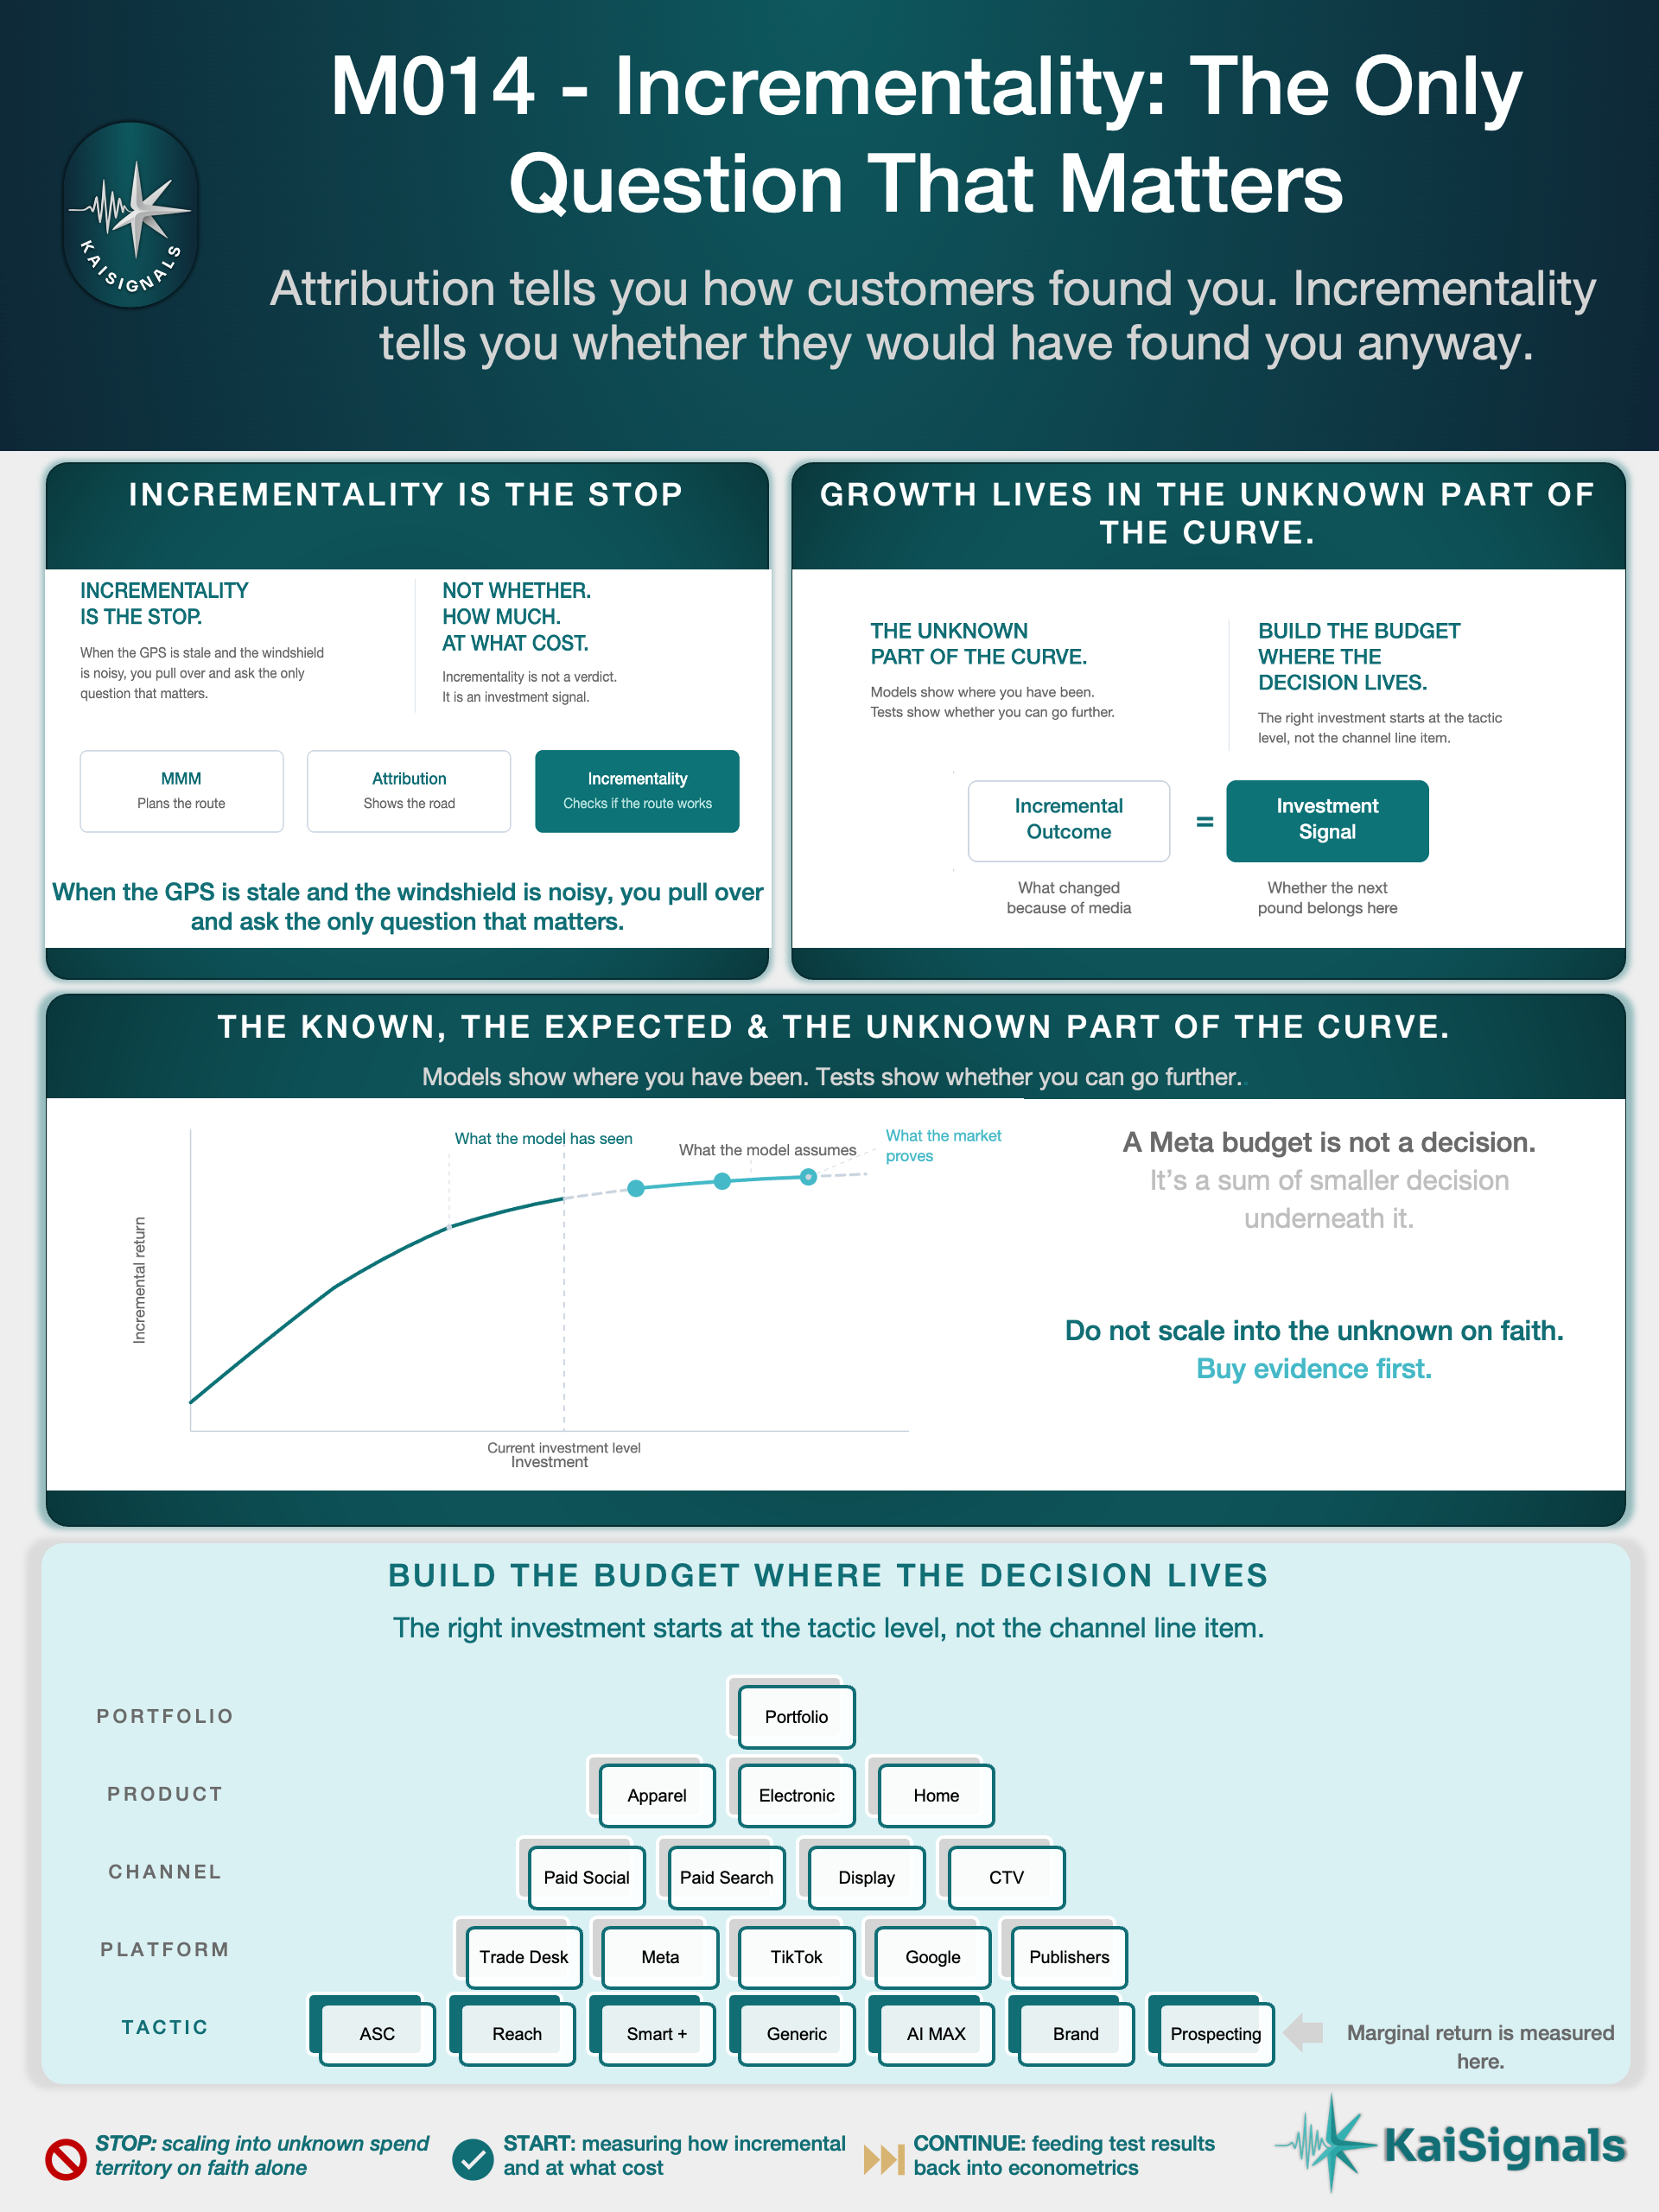
M014 - Incrementality: The Only Question That Matters
Attribution tells you how customers found you. Incrementality tells you whether they would have found you anyway.


Pulling Over to Ask for Directions
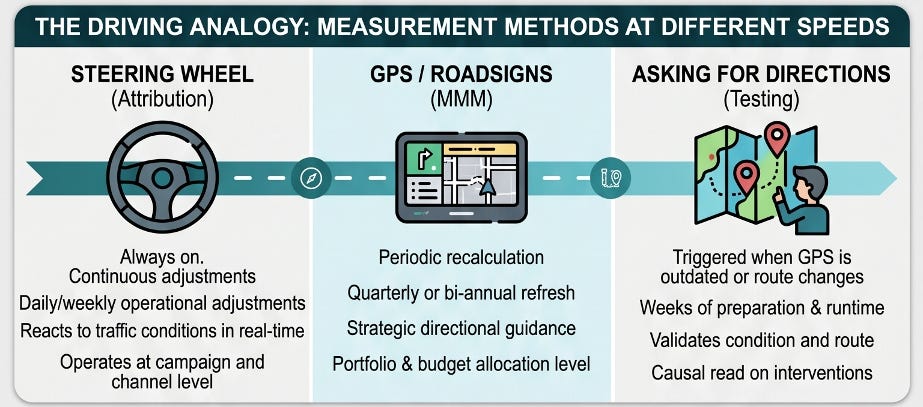
In M012, we looked at MMM as the GPS of media measurement. It plans the route. It shows the broad direction of travel, accounting for the terrain, the weather, and the conditions around you. It recalculates periodically. But it does not update in real time, and it does not always have the latest road information.
In M013, we looked at attribution as the windshield. It shows the traffic, the pedestrians, the movement ahead. It lets you steer. It lets you react. But the windshield only shows what is in front of you. It does not tell you whether you are on the right road.
Now we arrive at incrementality.
Incrementality testing is the act of pulling over and asking for directions. A deliberate pause. A point-in-time check. Not reactive. Not continuous. Intentional. You stop the car, step outside, and ask the question that neither the GPS nor the windshield answered: am I heading where I think I am? Would I have arrived here anyway without this particular route?
That is the question this article addresses. Not how to run an incrementality test. We covered the mechanics in M007. The question here is what incrementality testing tells you that no other method does, and how it translates into the investment decisions that sit at the centre of media planning.
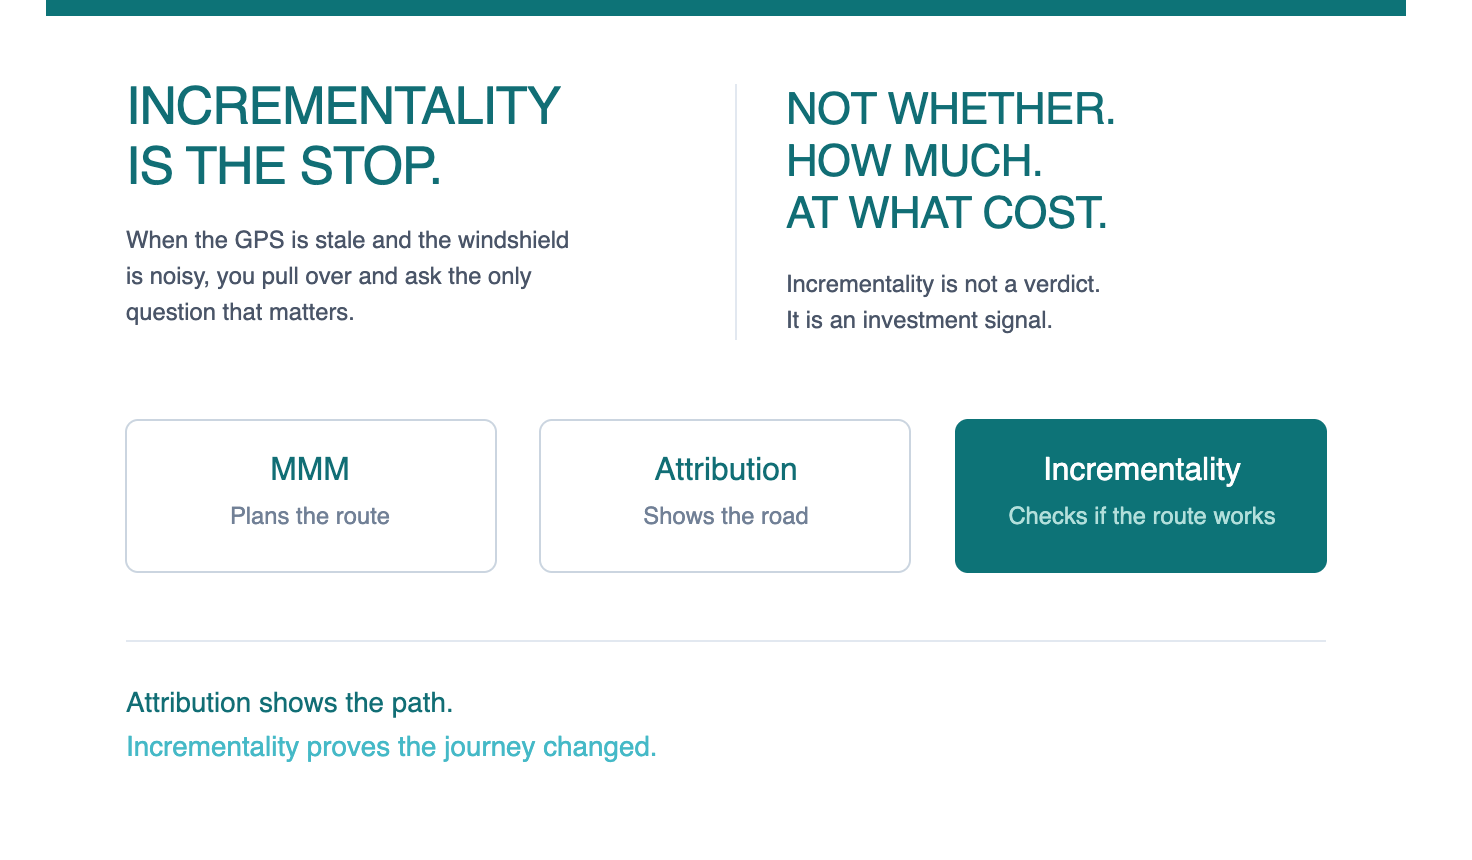
Not Whether. How Much. At What Cost.
There is a common misconception about what incrementality testing answers.
Most people think of it as a binary question. Is this activity incremental, or is it not? The test comes back positive or negative. You act accordingly.
That framing misses the point.
Incrementality testing answers two quantitative questions simultaneously. How incremental is this activity? And what does that incrementality cost? The first tells you the size of the effect. The second tells you the price of producing it. Together, they give you something neither MMM nor attribution provides on its own: an investment case.
Once you know the incremental outcome and the cost to create it, the decision becomes straightforward. Is the extra outcome worth the extra cost? If yes, invest more. If no, redirect the next pound somewhere it works harder. This is the Money In, Money Out philosophy applied at the level of individual activities.
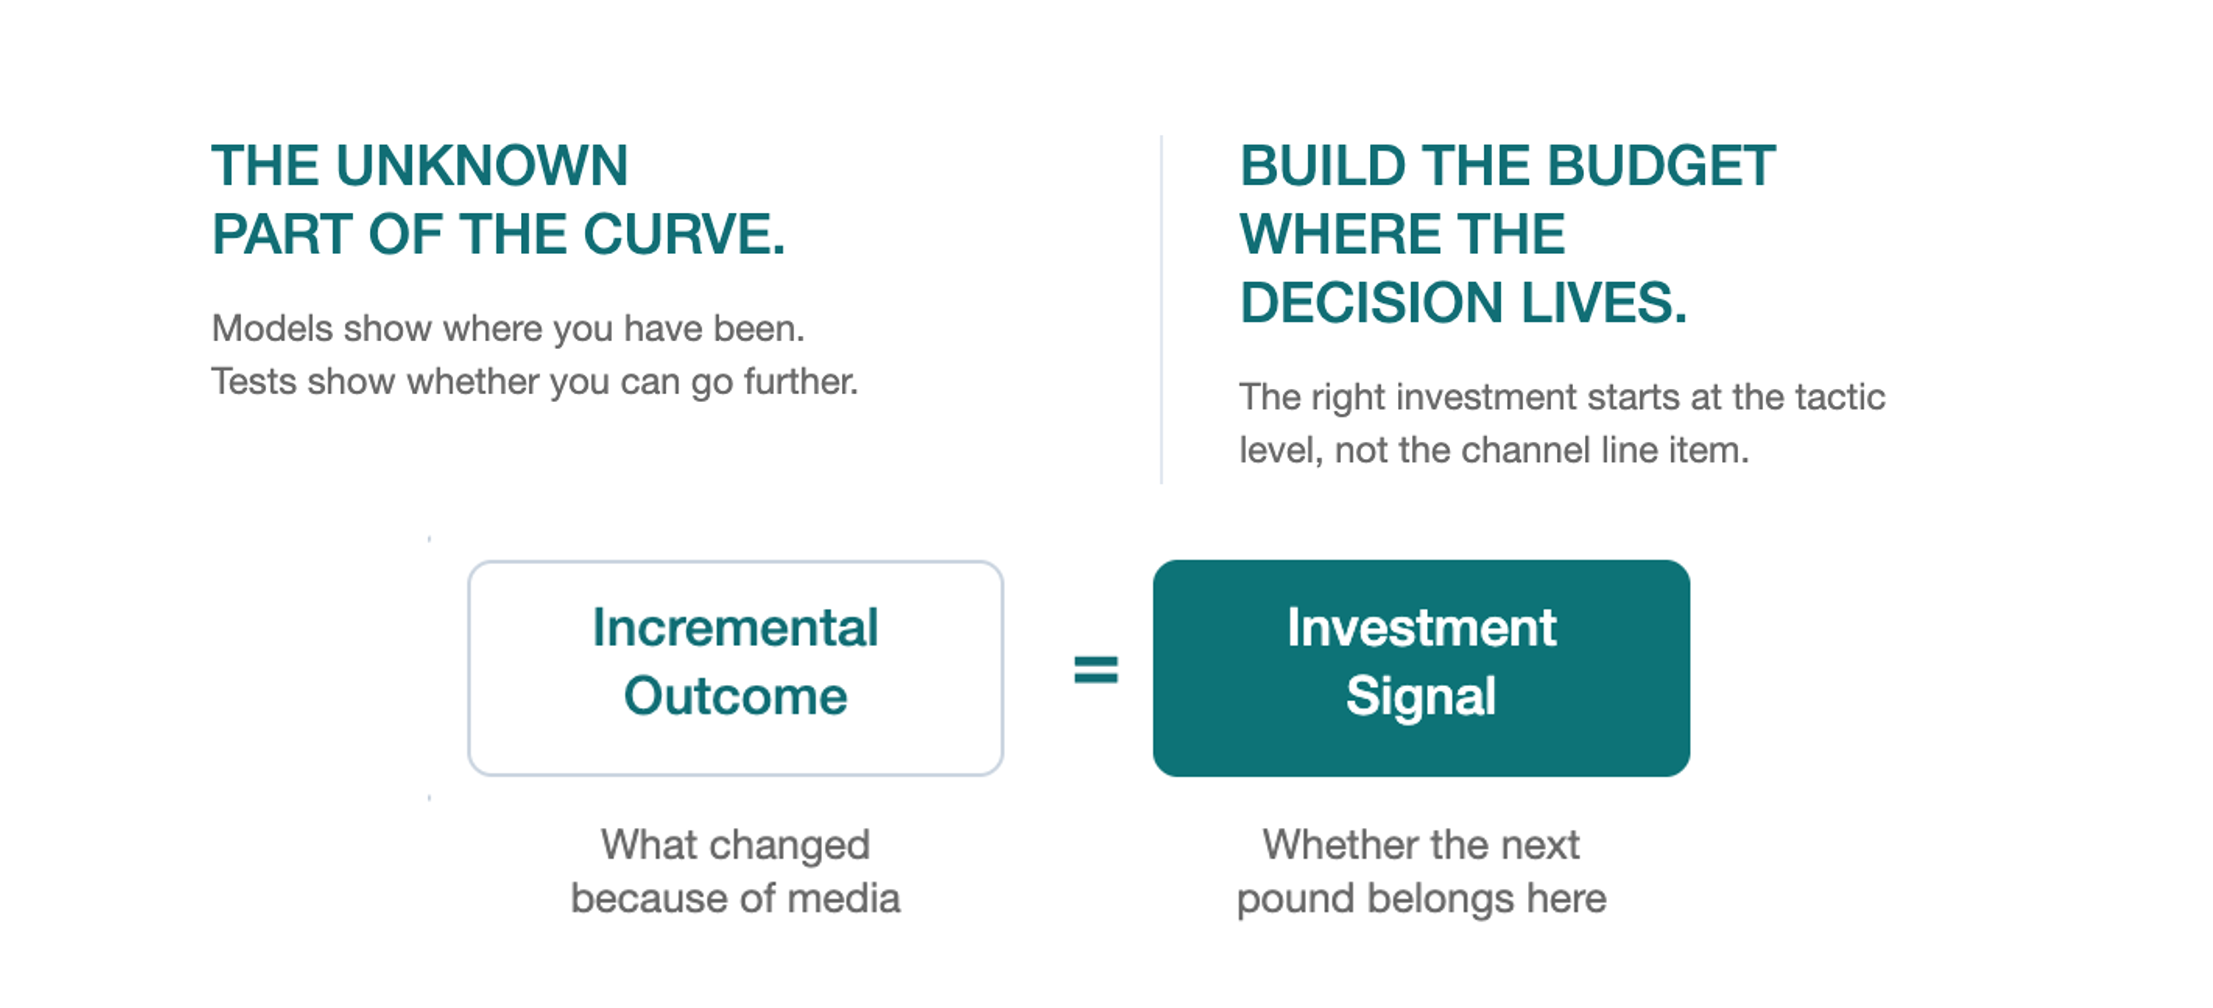
Incrementality is not a verdict. It is an investment signal. The quantification of causality and the cost associated with it.
What Incrementality Adds That the Others Do Not
If MMM, attribution, and incrementality testing are all trying to evaluate causality, why do you need all three?
Because each operates at a different resolution, a different speed, and with different blind spots.
Econometrics gives the portfolio-level view. It accounts for macroeconomic conditions, seasonality, and the interactions between channels. But it takes at least a quarter to produce recommendations, and it lacks the granularity to resolve individual tactics within a platform. It tells you that paid social is working. It does not tell you which tactic within paid social is working and which is saturating.
Attribution operates in near real time. It shows you which paths customers take and which touchpoints appear on those paths. But it is directionally correct at best. It reports credit distribution, not incremental effect. And it is structurally unable to distinguish between a touchpoint that created a customer and one that simply intercepted a customer who was already on the way.
Incrementality testing fills the gap that neither of the other two reach. It operates at the level of individual partners, campaigns within a channel, and specific technologies or tactical changes. It tells you whether a specific activity created an outcome that would not have existed without it. And it does so through controlled measurement, not modelled inference.
The relationship between these three is not competitive. It is collaborative. Econometrics learns from incrementality test results, incorporating them as priors that sharpen future model runs. Incrementality testing borrows econometric principles when designing experiments and isolating impacts. Attribution provides the real-time steering that keeps the system responsive between model updates and test cycles. Each compensates for what the others miss.
(For the experimentation mechanics behind incrementality testing, see M007. For the role of MMM, see M012.)
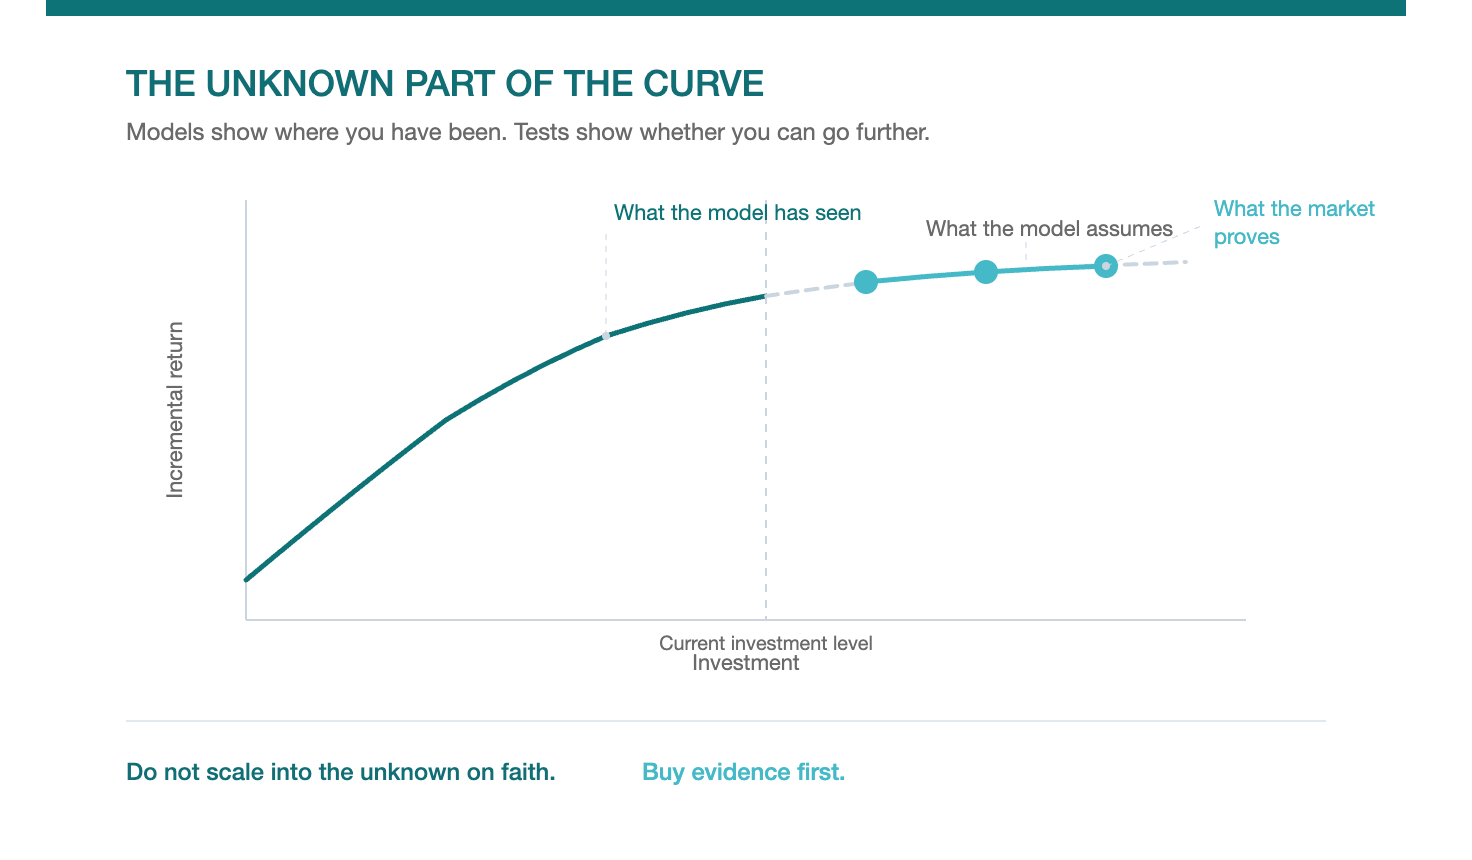
The Unknown Part of the Curve
Every planning tool has a boundary. On one side of it sits the territory you have observed. Your MMM curves, your digital performance benchmarks, your historical spend data. On the other side sits the territory you have not.
The problem is that the most consequential investment questions live on the wrong side of that boundary.
Should we double spend on this product? The model says marginal CPAs are well below the expected cost of acquisition. But the model has never seen spend at twice the current level. The curve stops where the data stops. Everything beyond it is extrapolation.
Should we invest more in this tactic? The channel-level curve suggests headroom. But the channel-level curve is a composite. Underneath it, different tactics have different scaling characteristics. Some are saturating. Some have room to run. The channel view masks the tactic-level truth.
Should we invest in this new targeting approach? There is no curve at all. The approach has never been tested in this market, at this scale, with this audience.
In each case, the existing planning tools tell you where you have been. They do not tell you where you could go. Incrementality testing is the only way to extend the curve into unknown territory with evidence rather than faith.
Extending the Spend Region
The first use case is simple in structure. A product where both digital performance metrics and econometrics showed marginal CPAs well below the expected cost of acquisition. On paper, this looked like a clear case of under-investment. The numbers suggested the budget could double and still deliver efficient outcomes.
But the budget had never been at that level. The data behind the curves covered only the observed spend region. Doubling investment would take the product into territory the model had never seen. That was the gap. Not a lack of signal. A lack of validated signal at the spend level the business wanted to move to.
The sequence followed a clear logic. The marginal CPA gap built the hypothesis. The incrementality test proved the hypothesis. And the result unlocked the budget.
The test came back significant. Performance held at the higher spend level. Marginal CPAs remained within thresholds. The product received twice the budget, and that became the signed base for all future quarters and the following year.
The story does not end there. The subsequent econometric study confirmed that at the new spend level, the product was nearing the top of the curve. More importantly, other channels at that point offered better marginal efficiency than pushing further within digital for that product. The next pound was redirected.
This is the discipline. Test, scale, monitor the curve, and redirect when marginal returns flatten. The system self-corrects. Incrementality testing is not a one-time event. It is the mechanism that keeps the investment calibrated to the evidence.
Building Growth Curves Through Experimentation
The second use case addresses a more structural problem. Curves existed at the channel level for paid social. But those curves were composites. Underneath the channel-level number sat individual tactics with very different scaling characteristics, different saturation points, and different marginal return profiles. The channel view masked the tactic-level truth.
Building tactic-level curves through the standard approach - collecting a long period of fluctuating spend data - was not practical. For a single tactic within a platform, that data is difficult to isolate. Other channels and contributing factors influence performance over the same period. Confounding variables contaminate the signal. And consciously varying spend levels over months for a small proportion of the total marketing budget is operationally difficult to sustain.
The alternative was to build the curves through experimentation. Instead of collecting months of observational data, run Conversion Lift Studies at controlled spend levels for each tactic. A small number of experimentally measured data points at controlled spend levels replaces the need for extended observational data collection. The broad shape of the curve - whether the tactic is at the bottom, the middle, or the top - becomes visible from those data points.
This was not perfectly precise. There would be more or less headroom than estimated. But directionally, it was close enough to act on. And the speed of reaching an actionable answer was incomparably faster than waiting for a year of fluctuating spend data to accumulate.
This approach was developed in partnership with Meta and has since been applied more broadly. The principle is straightforward: if you want to know the shape of a curve in territory you have not observed, you do not wait for the data to arrive on its own. You go out and buy the data points you need through controlled measurement.

What the Tactic-Level Curves Revealed
The results exposed a gap between what attribution reported and what incrementality measured.
Reach showed low or no performance in platform attribution. On the attribution dashboard, it looked like Reach was not delivering. But the Conversion Lift Studies showed significant incrementality. Reach was creating outcomes that the attribution system was structurally blind to. This is not a flaw in the attribution system. It is a function of how attribution measures: it tracks observed paths. Reach creates demand that often converts through other channels and other touchpoints that then receive the credit.
ASC performed well in attribution. But the Conversion Lift Studies showed it was performing even better. The gap came from indirect conversions captured through CAPI that platform attribution missed. The incremental effect was larger than the attributed effect.
BAU conversion campaigns were saturating. The incremental CPA was high relative to the other tactics. The curve was flattening.
Econometrics could not resolve any of this. The econometric model operated at channel level - paid social as a whole, combining multiple platforms. It did not have the resolution to differentiate tactics within a single platform.
The audience overlap between tactics was minimal, confirming that each tactic was reaching distinct cohorts rather than competing for the same audience.
The commercial action was clear. Budget moved from the saturating tactic into the ones with scaling potential. At the same total spend, incrementality nearly doubled. The budget did not increase. The allocation changed. And the outcomes transformed.
This is the power of tactic-level visibility. A “paid social budget” or a “Meta budget” looks like a single investment decision. It is not. It is a portfolio of smaller decisions, each with its own curve, its own saturation point, and its own marginal return. Incrementality testing is what makes those smaller decisions visible.
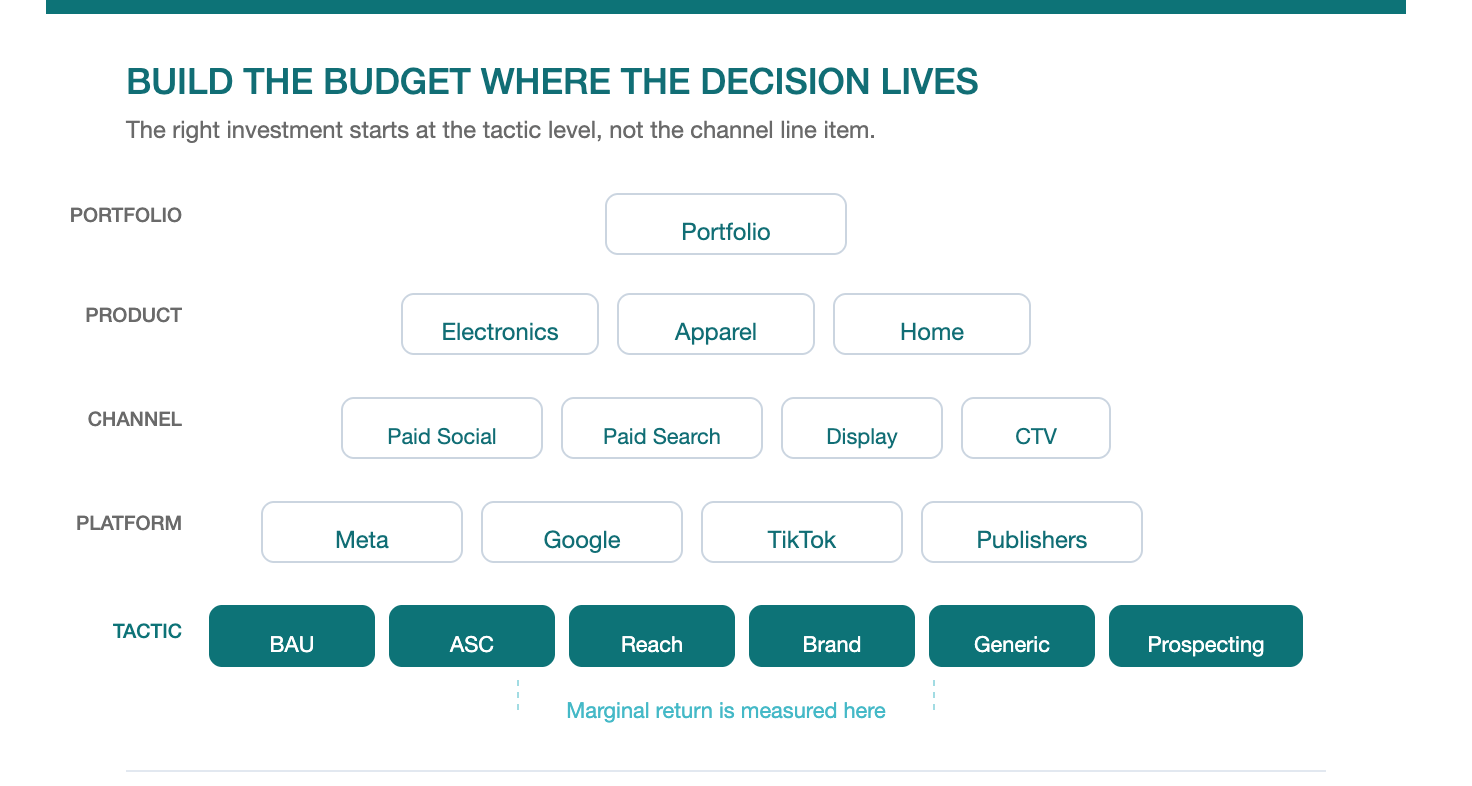
The Bottom-Up Investment Principle
The marketer who thinks in terms of “Meta budget” as a single line item is skipping the layer where the investment decision lives.
The right budget is not set from the top down. It is built from the bottom up. You right-size each tactic based on where its marginal return sits on its own curve. You sum the tactics to get the right investment for the platform. You sum platforms to get the right investment for the channel category. You sum channel categories to get the right investment for digital. You sum digital with other channels to get the right marketing budget for that product. You sum products to get the right marketing budget for the portfolio.
At every level, the same logic applies. The total is the sum of its optimised parts, not a top-down number divided across categories.
This is where incrementality testing earns its place in the planning process. It provides the tactic-level evidence that makes bottom-up budgeting possible. Without it, you are distributing a top-down number and hoping the platform’s algorithm makes the right choices underneath. With it, you are making the allocation decision at the resolution where the marginal return is actually discovered.
Valuing the OpenWeb Through Cookieless Testing
The third use case addresses a different kind of unknown. Not “how much should I spend at a higher level” or “which tactic should receive the next pound.” Instead: does this entire channel justify the investment?
The specific question was whether cookieless targeting through publisher first-party data cohorts could match or outperform traditional cookie-based targeting on the OpenWeb. The test design was a matched market study. Two groups of similar regions. One received BAU cookie-based display prospecting. The other received cookieless cohort-based prospecting through the same demand-side platform, the same publishers, the same creative, and the same budgets. The only variable was the targeting methodology.
The test ran across multiple products in two separate waves to check consistency across seasonality and different spend levels.
The results were unambiguous. For one product, cookieless targeting doubled sales and halved CPA relative to BAU. For others, it matched BAU performance with no loss. Reachability improved significantly because cookieless cohorts were not constrained by the shrinking pool of targetable cookie-based users.
Here is where it gets interesting. Platform attribution told the opposite story. On the attribution dashboard, BAU appeared to be winning. This is structural. Attribution relies on cookies to track paths. A cookieless approach, by definition, does not produce the signals that attribution measures. The matched market test bypassed that blind spot entirely by comparing outcomes at market level rather than at user level.
This test also answered a second question simultaneously. Because cookieless targeting was the only activity running on the OpenWeb, valuing the cookieless approach and valuing the OpenWeb channel were the same exercise. The test gave a sizing for what the OpenWeb was worth as an investment. If there had been other OpenWeb activities, each would have needed to be valued separately and aggregated - the same bottom-up logic as the Meta tactic-level story.
Building the Picture in Pieces
The practical reality of investment planning is that you rarely have incrementality evidence for every channel at the same time.
In this case, the walled garden investment (Meta) was sized through tactic-level Conversion Lift Studies. The OpenWeb investment was sized through the matched market test. Search was sized through econometrics, with incrementality testing on the roadmap but not yet executed. Summing these gave a total product-level view.
The picture was partially aligned. Where econometrics and experimentation agreed, the confidence was high. Where they diverged, the incrementality results fed back into econometrics as priors for future model runs. Over time, each round of testing sharpened the econometric model, and each model update refined the hypotheses for the next round of testing. The system got progressively more accurate.
This is the two-way dialogue in practice. Not one method replacing another. Not one source of truth overriding the others. A feedback loop where different evidence sources strengthen each other over time.
The operational advantage matters too. When the planning team owns both the testing programme and the budget allocation process, learnings translate into action without the friction of cross-team persuasion. The evidence moves directly into the plan.
The Road, the Wheel, and the Question
We have now looked at each of the three core measurement methods in isolation.
Econometrics is the GPS. It plans the route. It accounts for the terrain, the conditions, and the broader environment. It recalculates periodically. But it does not always have the latest information, and it does not update fast enough for real-time decisions.
Attribution is the windshield. It shows you the traffic, the pedestrians, the movement ahead. It lets you steer and react in real time. But it only shows you the road you are already on. It does not tell you whether the road leads where you think it does.
Incrementality testing is the stop. When the GPS is outdated, when the windshield shows a road that does not match the plan, you pull over and ask. A deliberate check. A point-in-time investment in knowing whether the route still holds.
No single method gets you to the destination alone. The trifecta works because each compensates for what the others miss.
There is a fourth signal worth noting. Brand health measurement - whether through brand lift studies or other long-term tracking - acts as an early warning system. If the road conditions ahead are deteriorating, if the signals that predict future demand are weakening, that tells you what to expect in sales six to twelve months from now. The other three methods are better at measuring what is happening now or what happened recently. Brand health measures what is coming.
We have spent four articles examining these methods individually. What each does well. Where each falls short. When to reach for which one. The next question is how to use them together. Not as three separate tools picked up in isolation, but as a coordinated system where each method strengthens the others. That is the subject of the next article.
If you are trying to translate these mental models into operating systems that run day to day, this is the problem KaiSignals works on.